
Analysis of precipitable water from MRCC4
Rather than relying on historical PMPs, the use of simulated PMPs for future periods will improve probable maximum flood estimates, enabling the designers of hydraulic structures to better plan their infrastructures.
Project details
Principal(s) investigator(s)


Context
In a changing climate, understanding how climate change may impact extreme rainfall and flood events is essential to ensuring that current and future hydrological structures can operate safely and efficiently well into the future. Hydrologists use the concept of probable maximum flood (PMF, the largest plausible flood that could occur at a given location) as a design criterion to ensure dam safety.
PMF is calculated from the greatest possible accumulation of precipitation for a given duration at a given location at a particular time of year, known as probable maximum precipitation (PMP). The evaluation of PMP is generally based on observations, without accounting for long-term climate trends. It is important to evaluate PMP in the context of climate change, as precipitation extremes are likely to change in the future.
The temporal and spatial resolution of regional climate models makes them interesting for calculating PMP, and some studies have already used RCMs to calculate future PMP. To do this, precipitable water, which is the total quantity of water vapour in an atmospheric column, must be calculated.
Objective(s)
-
Assess the ability of the 4th generation Canadian Regional Climate Model (CRCM4) to simulate precipitable water by comparing simulated values with new observational data (NVAP-MEaSUREs) and reanalysis data (ERA-Interim) over five Canadian basins of interest for dam managers.
Methodology
-
Extract precipitable water over the five basins using four CRCM4 simulations, two of which are historical (driven by ERA-Interim reanalysis data over a domain covering North America at 45-km resolution and Québec at 15-km resolution) and two of which are driven by global models CGCM3 and ECHAM5 over North America at 45 km; observational data NVAP-MEaSUREs (NASA Water Vapor Project Making Earth Science Data Records for Use in Research Environments); ERA-Interim reanalysis (ECMWF, the European Centre for Medium-Range Weather Forecasts);
-
Evaluate mean annual cycles, daily distributions and annual daily maximums for the simulated and observational data.
Results
The five basins under study were Nelson in Manitoba; Mattagami in Ontario; and Kénogami, Manic-5 and Saguenay in Québec. The NVAP-MEaSUREs (NVAP-M) dataset features combined observations of both column-integrated and layered global water vapour from a variety of surface and satellite sensors. We used the climate stream, which is consistent over time throughout the study period and available daily from 1988 to 2009 at a spatial resolution of 1° (~110 km).
ERA-Interim reanalysis data, available every 6 hours, was also used as a pseudo-observation of vertically integrated total water vapour and total water (including cloud water), which were integrated in the reanalysis forecasting process to produce an optimal initial state. For both the ERA-Interim data and the CRCM4 data (with an output frequency of 3 or 6 hours depending on the simulation), two methods were used to obtain daily values for each basin. The standard method consisted of computing the daily mean value (DMean).
The second method involved extracting the daily maximum (DMax), which is the maximum value of the instantaneous values, knowing that PMP calculations are based on the highest possible realistic values. Considering the 22 years of data available in the NVAP-M observations, we analyzed precipitable water’s behaviour through its annual cycle, its daily distribution, and its annual daily maxima.
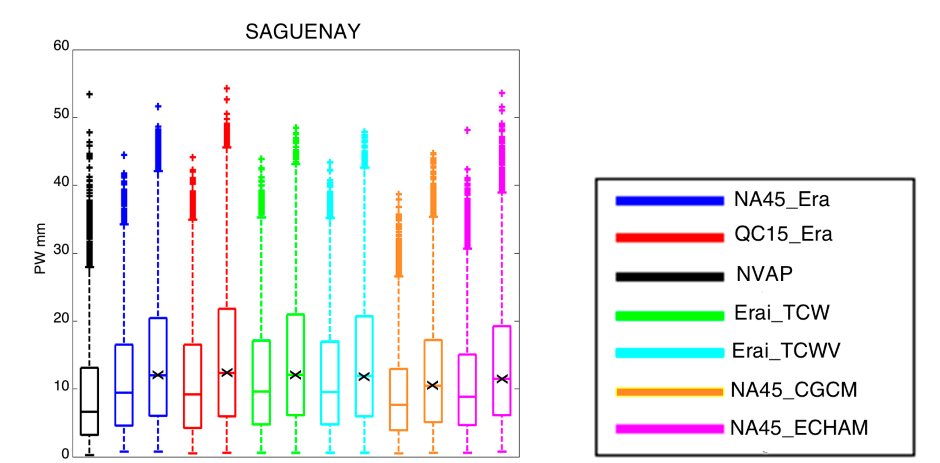
Figure 1: Distribution of daily precipitable water for 1988-2009 for the Saguenay River basin. NVAP-M observations are in black. CRCM4 driven by ERA-Interim domain over North America at 45 km is in blue and over Québec at 15 km is in red. ERA-Interim with total column water is in green, and with total column water vapour is in cyan. CRCM4 over North America driven by CGCM3 is in orange and by ECHAM5 is in magenta. In all cases except NVAP-M, values are calculated from the DMean (left) and DMax (right, indicated by a black cross on the median). The vertical boxes represent the 25th, 50th (median) and 75th percentiles of the distribution of daily values for the basin.
In general, the values for precipitable water simulated by CRCM4 are similar to those observed, and the model reproduces both the interannual and inter-basin variabilities.
In more detail, the following points are worth noting:
-
The differences between vertically integrated water vapour and total water from ERA-Interim reanalysis are negligible (~1 %).
-
ERA-Interim values for the annual cycle of mean precipitable water are higher than those from NVAP-M for all basins.
-
Precipitable water values from CRCM4 driven by ERA-Interim are very similar to its driving data.
-
The distribution of daily precipitable water from ERA-Interim and CRCM4 varies considerably according to calculation method (DMean or DMax).
-
Medians from DMean better represent NVAP-M medians for all basins, while extreme values are better represented by DMax.
-
The simulation at 15-km produces higher extreme values than simulations performed at 45-km and higher than the observations taken at coarser resolution (~110 km), without much influence on the mean behaviour.
-
Some underestimation is found with the CRCM4 simulation driven by the Canadian Centre for Climate Modelling and Analysis Model, version 3, consistent with a well-known cold and dry bias of the CRCM4-CGCM3.
-
The CRCM4 simulation driven by the European Centre Hamburg Model, version 5 (ECHAM5) is much closer to the observations, pointing to the importance of closely considering the regional–global model combination.
Overall, CRCM4's ability to reproduce the major characteristics of observed precipitable water makes it a tool able to provide precipitable water data that could serve as a basis for probable maximum precipitation and probable maximum flood studies at the basin scale.
Benefits for adaptation
Benefits for adaptation
Rather than relying on historical PMPs, the use of simulated PMPs for future periods will improve probable maximum flood estimates, enabling the designers of hydraulic structures to better plan their infrastructures.
This study used new NVAP-MEaSUREs integrated atmospheric water dataset to evaluate simulated CRCM4 precipitable water data for the historical climate in five Canadian basins. The quality of the results lead us to recommend the use of simulated precipitable water in the calculation of PMP, although the characteristics specific to each regional-global model combination remains a factor to consider in any study.
Scientific publications
Other participants
-
North Carolina Institute for Climate Studies
-
North Carolina State University