
PAVICS : Power Analytics and Vizualization for Climate Science
The PAVICS platform provides researchers with more effective access to the climate information they need for projects on climate change vulnerability, impacts and adaptation.
Project details
Principal(s) investigator(s)


Context
Climate projections play a crucial role in evaluating climate change impacts, vulnerabilities and opportunities. With the continual increase in spatial and temporal resolution of climate models, the growing number of model simulations, as well as increasingly complex data analysis methods, the computational effort required for state-of-the-art climate data analysis is accelerating at a furious pace.
This project, in collaboration with CRIM, aims to build a platform that streamlines climate scientist workflows. Running on networked supercomputers, the platform will provide tools to analyze and visualize large volumes of climate data to serve Ouranos’ most experienced users.
The focus will be on answering the most pressing needs identified: creation of standard and custom climate scenarios for impacts and adaptation studies, exploration, analysis and validation of climate model simulations, as well as visualization of climate scenarios.
Objective(s)
-
Accelerate the production of climate scenarios and services;
-
Provide better access to climate data in standard formats;
-
Facilitate the visualization of climate data;
-
Provide robust and effective climate data analysis services;
-
Reduce the time spent on climate data collection by Canadian researchers.
Methodology
-
Define use cases and explore available tools;
-
Establish collaborations with related initiatives;
-
Select technologies to support the infrastructure; Configure and deploy the servers;
-
Create a visual interface and develop processing algorithms;
-
Write tests and documentation and training materials.
Results
The PAVICS platform is intended for specialized researchers and technicians who are already familiar with the processing of raw climate data. It is an assemblage of specialized servers that communicate via established international standards. The platform includes, among other things, a netCDF data server, a server for indexing the data catalogue, a geospatial data server, three climate data processing servers, a server for managing users and permissions, a server for managing queries, and a web interface.
Communication between these different servers largely takes place via an Open Geospatial Consortium standard called Web Processing Services (WPS). The use of such a standard makes the platform highly interoperable with new services developed by other institutions. The services provided by PAVICS can be interfaced with third-party systems. This model encourages collaboration and helps avoid duplication of effort.
The services offered by PAVICS can be accessed via the web interface, and can also be run from within geospatial information systems, a programming console or an online notebook. The diversity of access options allows users from different backgrounds to access the same tools. One of the longer-term goals of PAVICS is to facilitate collaboration between scientists from different disciplines.
Indeed, the tools developed for PAVICS allow groups of researchers to set up systems offering services in a related field, such as hydrological modelling, and to combine them with PAVICS climate services. By formally codifying the process inputs and outputs, we wish to facilitate multidisciplinary collaboration within the climate change adaptation landscape.
The image below shows some of the tools offered by the PAVICS web interface, including the visualization and exploration of climate data, data searches and data analysis. The platform’s tools are also available from within geographic information systems and programming environments.
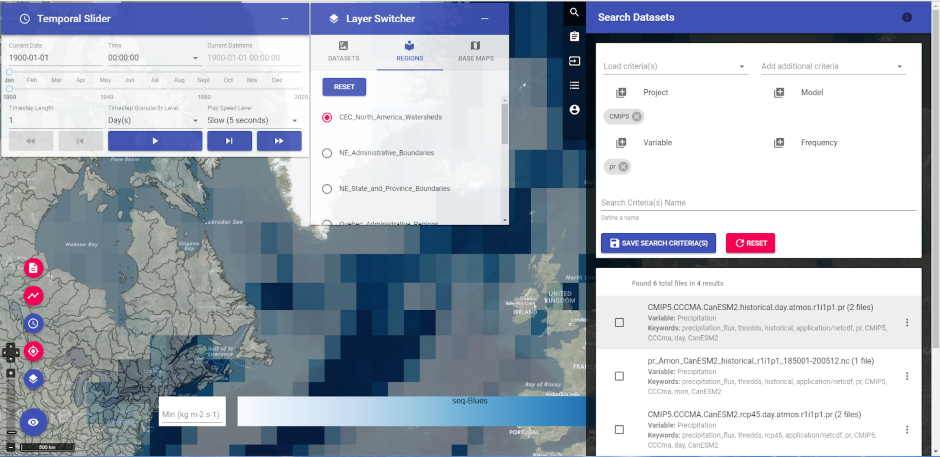
The datasets most commonly used to build climate scenarios are available, and a search interface allows users to find data files corresponding to different selection criteria. The web interface makes it possible to visualize netCDF file data and to run computational processes. Geospatial data layers are also available and can be used as input to various processes, for example, to perform spatial partitioning over a given region.
Benefits for adaptation
Benefits for adaptation
The PAVICS platform provides researchers with more effective access to the climate information they need for projects on climate change vulnerability, impacts and adaptation;
The automation of climate data processing will ensure faster access to new climate simulations produced by climate modellers and better quality control;
On the longer term, PAVICS could serve as an interface for using climate scenarios to drive impact models.
Scientific publications
Funding
Other participants
-
Pacific Climate Impacts Consortium (PCIC)
-
Calcul Québec
-
Direction de l’expertise hydrique (DEH) / Ministère du Développement durable, de l’Environnement et de la Lutte aux changements climatiques (MDDELCC)