
Interactive Atlas of the Vulnerability of the Quebec Population to Climate Hazards for Local and Regional Stakeholders
Québec’s municipal managers, professionals and planners have a new tool oriented to their needs at their disposal for assessing and mapping population vulnerability to heat waves and hydrometeorological hazards.
Project details
Principal(s) investigator(s)

Context
The increased frequency and intensity of extreme weather events caused by climate change is exacerbating the threat to the health and safety of populations.
The vulnerability of humans to these hazards varies in time and space, with certain groups being more at risk than others. The municipalities, be they local or regional, are faced with the social and economic impacts of climate change. However, with the exception of a few large cities, municipalities generally lack the material and human resources to perform geographic analyses of vulnerabilities to climate hazards.
This means that many are poorly equipped to deal with this threat, even though they have a key role in ensuring the safety of their citizens.
Objective(s)
-
To develop an interactive online atlas providing pertinent and valid information on the geographical distribution of the vulnerability of the Quebec population to climate hazards.
-
The two prioritized hazards are heat waves and extreme precipitation events.
Methodology
-
Identification of existing tools and methods for analyzing vulnerabilities; Consultation with professionals and managers of Quebec municipalities in order to take stock of their perceptions of vulnerability to climate hazards and their needs with regard to assessment tools;
-
In collaboration with potential users, construction of indices using demographic and socio-economic data of the built environment and data on natural hazards;
-
Development of an atlas allowing to disseminate the vulnerability indices of communities based on expressed needs;
-
Drafting of a methodological guide.
Results
The results of the consultation show that a large proportion of the municipalities and RCMs consulted are affected by one of the hazards targeted by the research project. Furthermore, the results justify the implementation of the atlas as a tool for urban planning and public awareness.
The information collected during the consultation served to contextualize the use of geospatial data for the purpose of analyzing population vulnerability in a planning context, and to develop an interactive online tool for the exploitation and visualization of geographic information. It also became clear that the geographic data layers needed to be made available in the Ministère des Affaires municipales et de l’Occupation du territoire (MAMOT)’s Territoire application, which is already known and used by urban planning professionals in Québec municipalities.
All the geographic data layers containing population vulnerability indices and their various constituent variables have been incorporated into an online platform for public use. This platform features a map of the inhabited portions of the dissemination areas of Québec municipalities. Novice users can navigate through the map, click on geographic entities to open popups, and display layers of information such as heat wave vulnerability index (Figure 1).
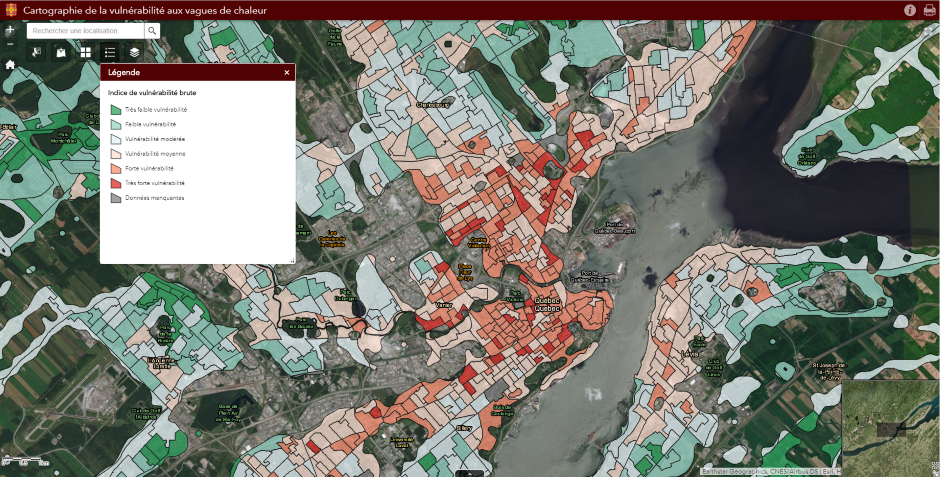
Figure 1 : Gross heat wave vulnerability index – Québec City sub-region
Features for more experienced users have also been included. A user can thus filter entities based on tabular or spatial criteria, extract data from selected entities, or add personal data to the map. A website developed by the research team clearly explains what these maps represent and what they can be used for.
The different maps have been available for online consultation since mid-September 2018 on the website https://atlas-vulnerabilite.ulaval.ca/. The geographic data from the analyses have also been integrated in the MAMOT’s Territoires application.
It should be noted that these maps do not show risk or exposure, but identify areas where the population is more vulnerable to the hazards in question.
Benefits for adaptation
Benefits for Adaptation
Québec’s municipal managers, professionals and planners have a new tool oriented to their needs at their disposal for assessing and mapping population vulnerability to heat waves and hydrometeorological hazards.
Québec’s municipal managers, professionals and planners have a common vision and vocabulary for collaboration with public health on issues relating to land use planning and climate change.
The online interactive atlas developed under the project provides the general public with access to knowledge about the vulnerability indices of Québec’s municipal communities.
Scientific publications
Funding
Other participants
-
Local and regional municipalities
-
Institut national de santé publique