
Regional Climatology and Adaptation to Climate Change
Ouranos is a collaborative innovation hub enabling Quebec society to better adapt to an evolving climate. The consortium brings together upwards of 450 researchers, experts, practitioners and decision-makers from an array of disciplines, collectively working on numerous applied research programs and projects.

Better Understand Climatology and Climate Change Adaptation
From climate evolution to impacts and vulnerabilities, all the way to adaptation solutions.
Explore the rigorous scientific foundations needed to understand change.
Dive into climate phenomena in Québec and discover observed and projected changes, their impacts, and possible solutions.
Explore our learning tools designed to support decision-makers and practitioners in taking action.
The latest news
Understanding the IPCC: From Science to Policy Decisions
The Intergovernmental Panel on Climate Change (IPCC) is an international organization established in 1988 by the United…
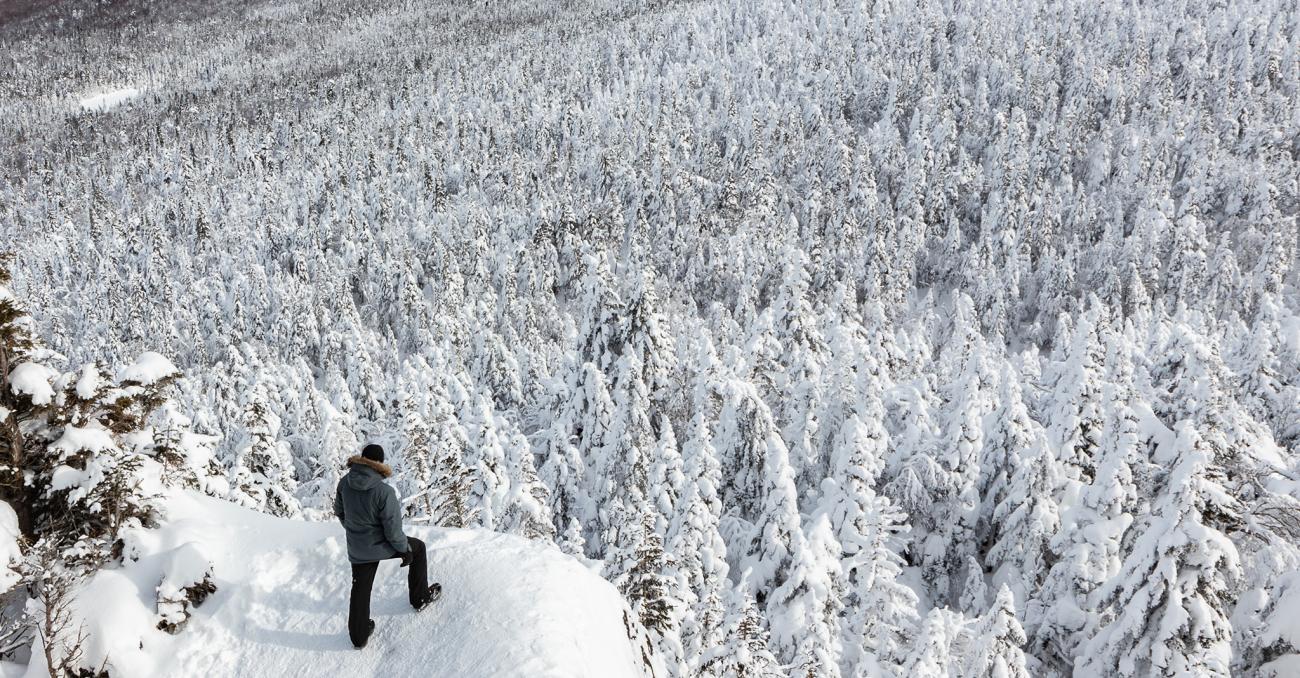
Climate change: What will winters in Quebec be like?
Quebec is known for its harsh winters, snowy landscapes and iconic winter activities. But due to climate change, these seasonal traditions are changing rapidly. The winter…
Deepen Your Knowledge
Broaden your perspectives with a selection of diverse resources from our content. Explore articles, accessible summaries, impactful projects, ongoing initiatives, and much more.
Browse our contents

Join the network
By subscribing to our communications, you will receive the latest news and publications from Ouranos directly in your inbox, along with updates on ongoing projects and invitations to our events and webinars.