
Precipitation
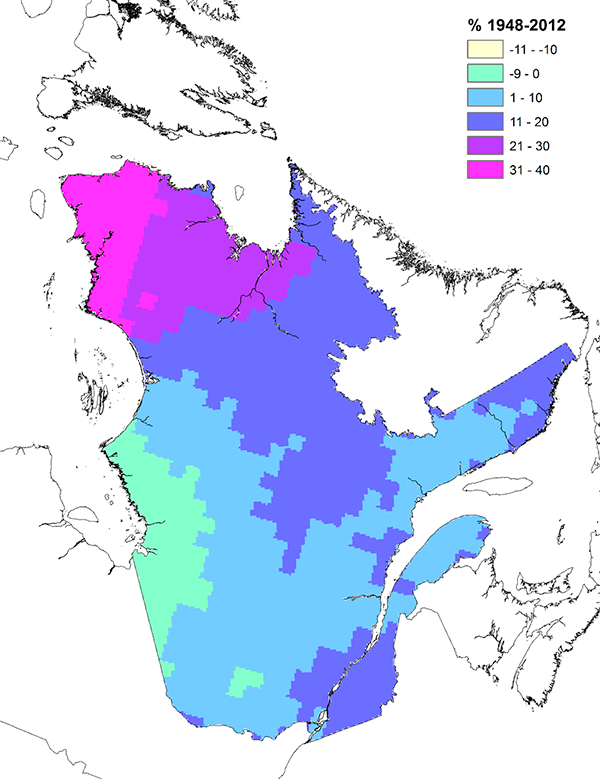
Figure 1 : Observed changes (%) in total annual precipitation in Quebec from 1948 to 2012 based on linear trends. Source of figure: Adapted from Figure 4 of Vincent et al., 2015.
Average annual precipitation has increased by 10.5% in Quebec over the past few decades. The increases are greater in the north, where they reach 35%. In southern Quebec, they are limited to between 5 and 15%. There are also regions where there have been no changes or where amounts have decreased slightly, such as near James Bay (Figure 1).
The differences between regions appear to be major when expressed as a percentage. However, this data needs to be put into perspective: since precipitation is more modest in the north, even small changes in absolute values result in large percentage changes.
On a seasonal basis, average increases across the province are highest in spring and fall (about 20%) and lowest in summer and winter (about 6%). Seasonal declines are also noted in a few regions, particularly in winter in the southeast of the province and in spring and summer near James Bay.
The proportion of precipitation that falls in the form of snow compared to rain has decreased over the past few decades in Quebec. Decreases are greater in spring and fall, particularly because of warming during these two seasons.
Various precipitation indices have been analyzed to describe observed changes in precipitation. Between 1948 and 2012, the number of of intense rain days increased significantly in Quebec. Other indices, such as the number of rainy days and the maximum amount of rain and snow in 1 day, have increased slightly, while the number of snowfall days has slightly decreased. For Canada as a whole, there is no available observational evidence of changes in extreme precipitation amounts accumulated over a period of one day or less.