
Providing climate scenarios for the Canadian Arctic with improved post-processing methods
This recent Arctic regional climate portrait provides decision-makers with climate data for sectors that are not covered by the observation stations generally used.
Project details
Principal(s) investigator(s)


Context
Providing climate information and services in the Canadian Arctic is a challenge on several levels. First, our ability to characterize the current climate in the Arctic is more difficult than for mid-latitudes due to sparse observing networks and large differences in historical climate reported from available reanalysis and gridded datasets. Second, there is a large range in the magnitude and timing of the simulated climate change signal in the Arctic due to the complexity of processes and feedbacks involved in climate models.
As a consequence, post-processing, namely the design of climate scenarios by merging observed and simulated information, is a non-trivial task. Post-processing consists of both downscaling and statistical adjustment of climate simulations, necessary to meet the needs of users at the Arctic community level. While previous projects made major contributions in this area, a number of challenges, gaps and uncertainties in providing climate scenarios for Arctic applications remain, such as scenarios for extremes, wind and marine areas.
Objective(s)
-
Provide ArcticNet IRIS related projects with climate scenarios that benefit from state-of-the-art post-processing methods.
Methodology
-
Developing univariate statistical adjustment methods for wind at coastal sites where there is in situ observations, and then over marine areas where other reference datasets will be used;
-
Assessing the impact of observational uncertainties (OU) on scenarios for temperature and precipitation;
-
Developing methods that consider correlations between atmospheric variables, for better assessing the impacts of climate change, notably on the dynamics of sea wave and fast ice;
-
Characterizing daily extremes of temperature and precipitation in observational products, simulations and scenarios.
Results
Reference climate maps (1980-2004) were created for 51 climate indices (21 for temperature, 12 for total precipitation, 9 for liquid and solid precipitation, 5 for snow cover, 5 for wind). For example, Figure 1 shows annual mean temperature.
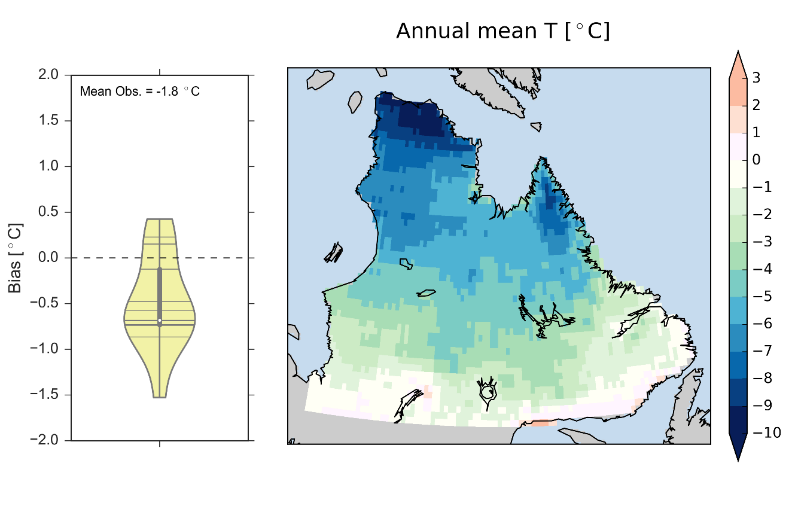
Figure 1: Reference climate (1980-2004) for annual mean temperature in °C (AgMERRA reanalysis). The violin plot (VP) on the left shows the bias between station values and corresponding values at the closest AgMERRA grid point. The value at the top of the VP corresponds to the annual mean temperature recorded over all stations. The horizontal lines on the VP represent the bias of each station/point pair.
Maps of the simulated changes for the IRIS-4 region for the 2040-2069 and 2070-2099 horizons were also produced for all indices. Coordinated Regional Climate Downscaling Experiment (CORDEX) simulations combining different regional and global models were used. Figure 2 presents an example of maps of mean June-July-August precipitation for the 2070-2099 horizon using the RCP 8.5 emissions scenario and shows that northern Québec will experience significant changes by the end of the century.
The most significant changes concern winter indices (e.g. annual fraction of solid precipitation, number of days of frost, duration of snow cover) and extremes (e.g. 99th percentile of daily precipitation, extreme precipitation, frequency of hot nights). The impact of climate change on the ice and wave regime was also analyzed. The coastal maritime climate is almost certain to change profoundly over the next century.
The period of ice cover will become considerably shorter, so that strong fall and spring winds will be more likely to generate waves with a significant impact on the coastline. Several maps were produced showing the evolution of various coastal climate indices (e.g. maximum annual ice cover, ice cover start and end dates, mean wave height) under future climate conditions.
Figure 3 presents an example of the results for mean wave height. The increase in wave height can be explained by a longer ice-free period resulting in the generation of larger waves earlier in the spring and later in the fall.
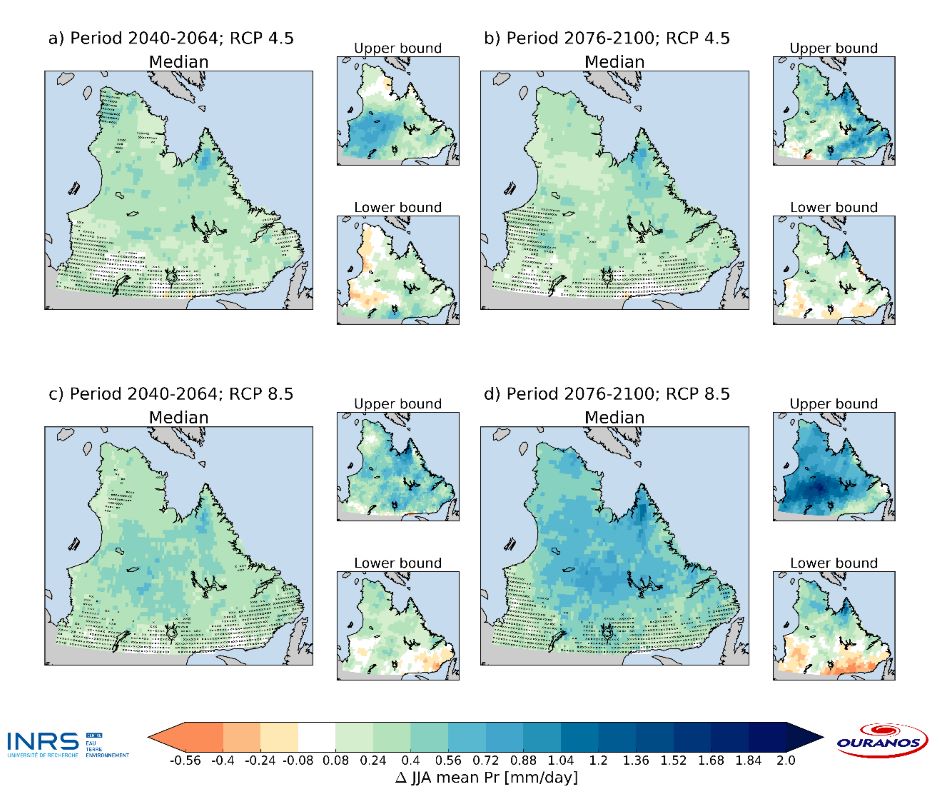
Figure 2: Changes in mean June-July-August precipitation between the reference period (1980-2004) and 2076-2100 for the RCP 8.5 emissions scenario (mm/day). The central map shows median simulated change for each grid point. Points where at least 10% of the simulations disagree with the direction of change (positive or negative) are marked with an ‘x’. The two small secondary maps show the dispersion of the results between simulations. The ‘Upper bound’ maps correspond to the simulation showing the greatest change across the territory. The ‘Lower bound’ maps correspond to the simulation showing the smallest change. The horizontal lines on the VP represent the bias of each station/point pair.
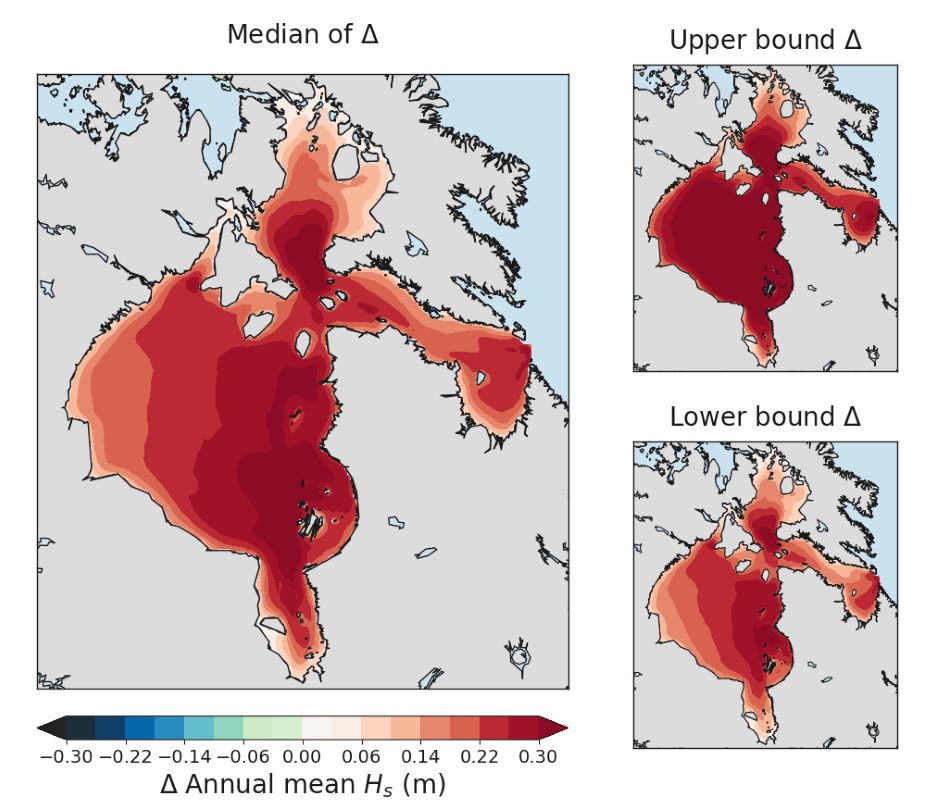
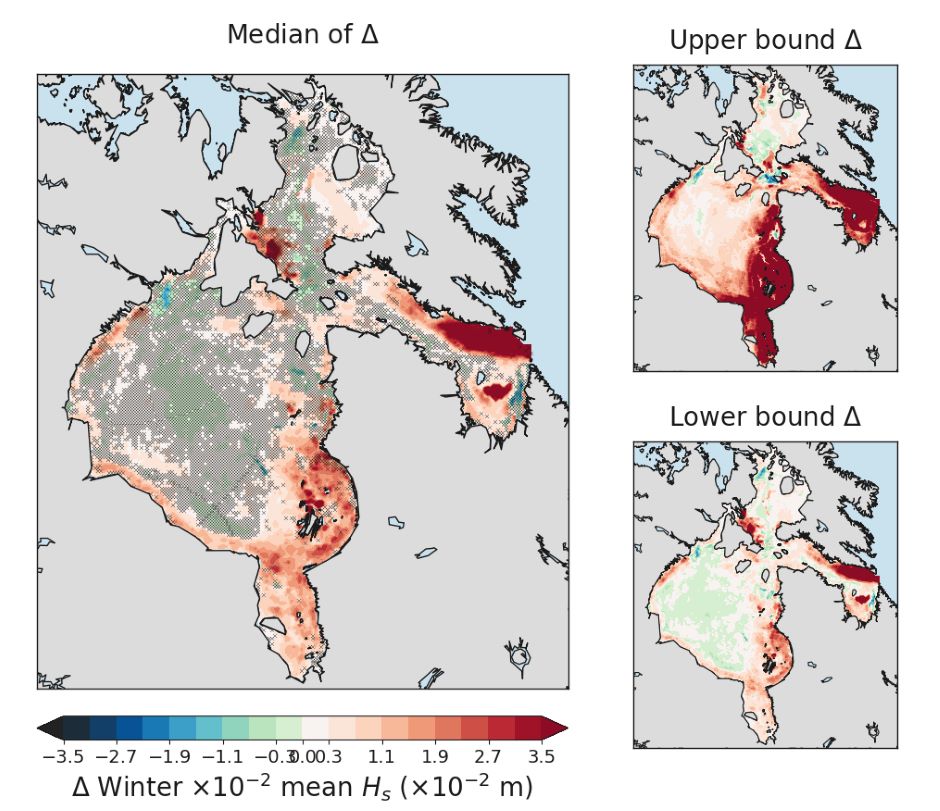
Figure 3: Changes between the future period (2076-2100) and the reference period (1980-2004) for mean (a) annual and (b) winter average wave height. The main maps show the simulated median for each grid point. The two small secondary maps show the dispersion of the results between simulations. The ‘Upper bound’ maps correspond to the simulation showing the greatest change across the territory. The ‘Lower bound’ maps correspond to the simulation showing the smallest change.
Benefits for adaptation
Benefits for adaptation
This recent Arctic regional climate portrait provides decision-makers with climate data for sectors that are not covered by the observation stations generally used;
Climate information (reference and future climate) has already been provided to a dozen research projects;
The Nunavik regional government has also used the results for regional parks planning.
Funding
Other participants
-
Centre d’études nordiques (CEN)
-
Environment and Climate Change Canada