
Freezing rain
In North America, climate projections show a northward shift in the area affected by freezing rain. Quebec is in a transition zone between a projected increase in freezing rain in the north and northwest, and a decrease in the southeast of the continent.
Projected changes in annual hours of freezing rain by region in Quebec
Learn more about the changes to freezing rain in Quebec.
Quebec regions north of the 50th parallel that are far from the coast can generally expect a gradual increase in the median number of annual hours of freezing rain compared with the period from 1980 to 2009. These hours of freezing rain will occur mainly between December and May.
On the other hand, in most areas of Quebec south of the 50th parallel and in coastal regions of the north, a gradual decrease in the median number of annual hours of freezing rain is projected compared with the period from 1980 to 2009. Episodes of freezing rain will occur mainly between December and February.
By the end of the century (2071-2100), as shown in Figure 5, projections indicate that the number of annual hours of freezing rain will decrease in the southern valleys and on the northern coasts compared with the period from 1981 to 2010. Little change or an increase in the number of hours of freezing rain is forecast for the rest of Quebec.
Consult the climate projections for freezing rain in Quebec.
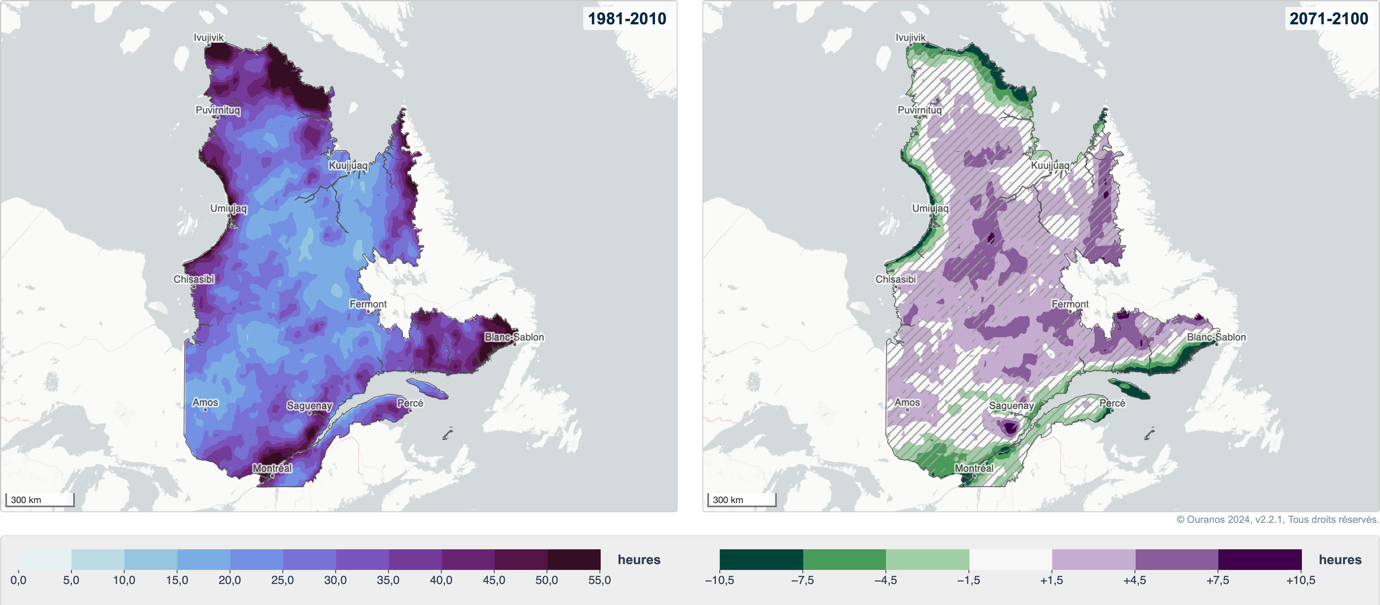
Figure 5: Median change in annual hours of freezing rain between the periods 2071-2100 and 1981-2010 based on a moderate emissions scenario (RCP4.5) as projected by an ensemble of four CRCM5 simulations and three diagnostic methods used to detect freezing rain in the simulations. Hatched areas indicate where there is a lack of consensus on the sign of the change among members of the ensemble (less than 80% of members agree). Figure produced and published on Climate Portraits, the Ouranos consortium portal on regional climatology and climate change adaptation.
Global warming levels
In its latest assessment report, the IPCC uses a new approach to anticipate the impacts of climate change, based on the level of global warming. This method differs from the conventional approach, which compares changes between a specified future period (e.g. 2071-2100) and a historical period of the same duration (e.g. 1991-2020).
Given the lack of specific projections for freezing rain, and in order to optimize the use of climate simulations, the approach adopted for this phenomenon is therefore to examine changes in the climate as a function of different levels of global warming. The data is presented based on three distinct levels of warming: 2°C, 3°C and 4°C, defined in relation to the pre-industrial period (1850-1900).
For global warming of 4°C (Figure 6c), a significant average decrease of at least 5 hours of freezing rain per year is projected in the St. Lawrence lowlands, as well as over a large part of the Outaouais region and the southern half of Abitibi-Témiscamingue. In the Montréal region, downward projections are even more pronounced, in the order of 15 to 20 hours per year. On the Côte-Nord coasts and in Nunavik, significant reductions in the number of hours of freezing rain per year are forecast.
If global warming is lesser, there is little consistency between the weak signals of change, except in southeastern Nunavik and in areas of Côte-Nord bordering Labrador, for which an average increase of 5 to 10 hours per year is projected starting at 3°C.
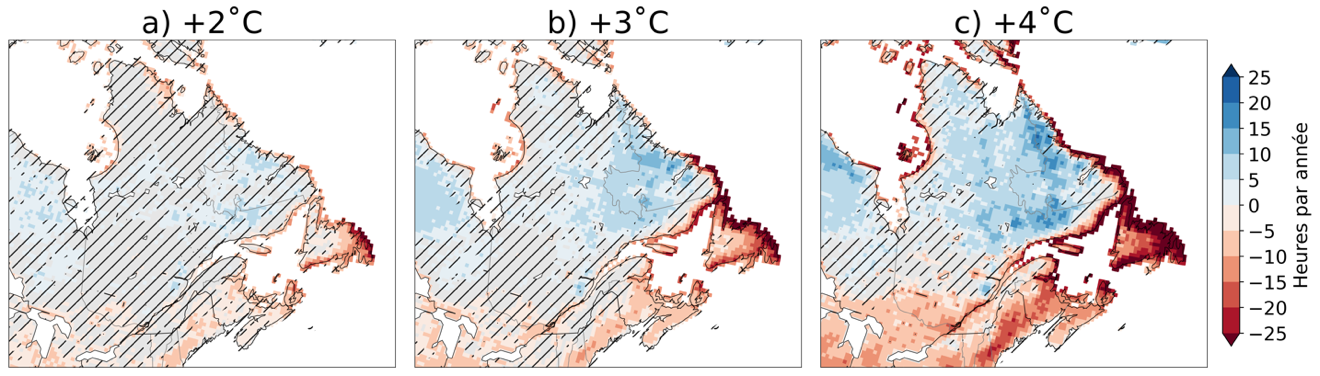
Figure 6: Average change in median annual hours (hr/yr) of freezing rain projected by an ensemble of four CRCM5 simulations and four diagnostic methods used to detect freezing rain in the simulations. Changes are shown between the historical period from 1980 to 2009 and the periods in which +2˚C (a), +3˚C (b) and +4˚C (c) global warming is reached compared to the pre-industrial period (1850-1900), across Quebec. In the hatched areas, less than 80% of the combinations of simulations and diagnostic methods agree on the sign of change. Data from McCray et al. (2022).
Seasonal changes
Climate projections point to a shift in the time of year when freezing rain events occur most frequently. Figure 7(c-f-i) illustrates the projected changes for 4°C of global warming. For autumn, we see a decrease in freezing rain hours and a consistent signal in southern Quebec.
The winter map shows a sharp increase in central Quebec, but a decrease in the southern valleys and on the coasts, while the spring map shows a sharp increase in the far north of Quebec. At lower levels of global warming (Figure 7), the seasonal signal is less consistent and the signals of change are weaker.
In southern Quebec, in the valleys and on the coasts, projections show a decrease in the frequency of extreme freezing rain events as warming increases, but they are still possible. There could be an increase in the number of intense episodes in certain regions of northern Quebec, and a 20 to 40% increase in the quantity of accumulated ice, according to certain studies.
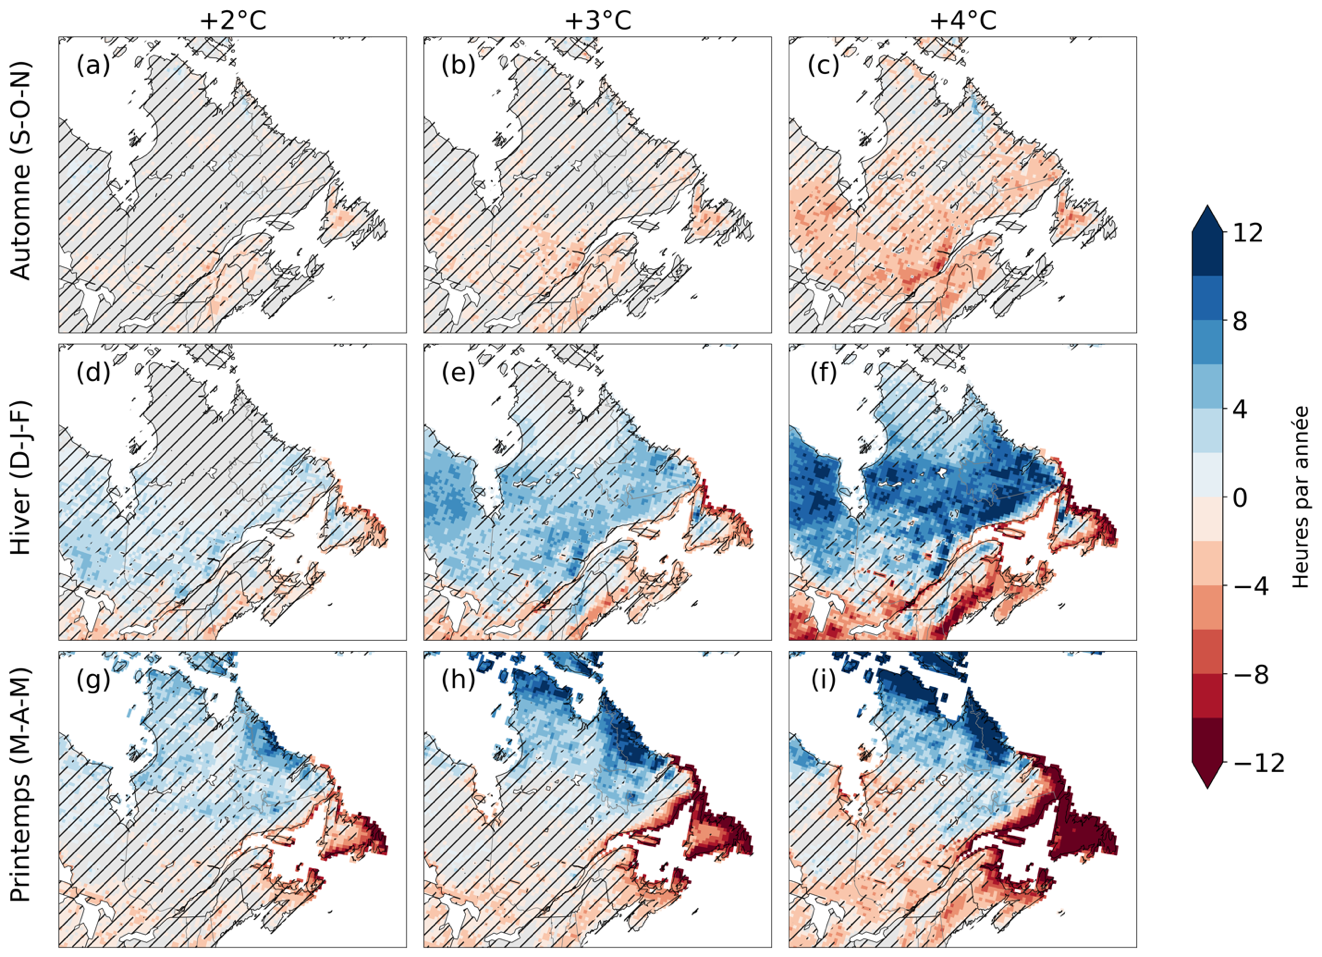
Figure 7: Average change in median annual hours (hr/yr), presented by season, of freezing rain projected by an ensemble of four CRCM5 simulations and four diagnostic methods used to detect freezing rain in the simulations. Changes are shown between the historical period from 1980 to 2009 and the periods in which +2˚C (a), +3˚C (b) and +4˚C (c) global warming is reached compared to the pre-industrial period (1850-1900), across Quebec. In the hatched areas, less than 80% of the combinations of simulations and diagnostic methods agree on the sign of change. Data from McCray et al. (2022).
REturn to the observed changes
CONSULT the impacts of freezing rain
Last update of the page: April 2024.