
You may have already tried out Climate Portraits, a platform developed by Ouranos that allows you to explore past, present, and future climate trends in Quebec.
But do you know how scientific research is turned into interactive maps?

Travis Logan, the Climate Platforms, Data and Operations Coordinator at Ouranos, gives us a behind-the-scenes look at the science behind this tool.
The origin of the simulations used in Climate Portraits
Global climate models
Most of the climate indicators available on Climate Portraits (e.g., the number of warm days or freeze-thaw events) are calculated based on an ensemble of simulations generated by global climate models as part of the CMIP project: large international collaborations in which climate science teams test different models at the global scale using the same protocols. Now in their 6th iteration (CMIP6), these experiments deepen our understanding of climate change, allow models to be compared, and provide the scientific community with a common reference.
Regional climate models
That said, for certain climate phenomena that require smaller-scale representation, such as freezing rain and snow cover, Climate Portraits uses data simulated by regional models, like the Canadian Regional Climate Model. This model, developed by the ESCER centre at UQÀM in collaboration with Environment and Climate Change Canada and Ouranos, has enough resolution to distinguish different types of precipitation and thus provide climate information at a finer scale than global models do.
Climate models are complex software programs that simulate the interactions between the atmosphere, ocean, ice, and land, using equations based on the laws of physics. Their execution generates climate simulations that represent the changes in the climate from the pre-industrial period (1850) until the end of the century (2100).
De la simulation à l’indicateur climatique : les étapes clés
 The first step is to choose which climate models to use. In its Sixth Assessment Report, the Intergovernmental Panel on Climate Change (IPCC) notes that some CMIP6 models project warming that is considered too fast. Based on these recommendations, Ouranos selected 15 global models, out of around twenty, that are deemed more realistic in representing the future climate of Quebec.
The second step is to adjust the daily temperature and precipitation data from the simulations by these 15 models to a finer scale. To do this, Ouranos has developed a statistical downscaling algorithm, found in the freely available Xclim software, which allows minimum and maximum temperatures as well as total precipitation to be adjusted to match the past climate in Quebec. This provides corrected, more realistic projections for Quebec. Xclim is also increasingly used by the international scientific community, which is testing it and helping to improve it. The result of these corrections is called: Ensemble de simulations post-traitées d’Ouranos (the Ouranos ensemble of bias-adjusted simulations, also known as ESPO-G6-R2).
Using the corrected dataset, the next step is to calculate useful indicators for climate change adaptation, such as temperature exceedances and precipitation thresholds. The results, initially annual, are grouped into 30-year periods to outline the climate of the future and to compare it with that of the past.
Lastly, this information is brought together on the Climate Portraits platform, where it takes the form of maps, graphs and interactive tables, so that users can explore it and use it to support climate change adaptation.
![]()
Lastly, this information is brought together on the Climate Portraits platform, where it takes the form of maps, graphs and interactive tables, so that users can explore it and use it to support climate change adaptation.
Data reliability and updates
The platform evolves based on what is scientifically sound and what is relevant for Quebec, with updates generally carried out each year.
Whenever a new climate indicator or threshold is added to the platform, it must be supported either by published research validated by the scientific community, or by an internal validation exercise.
For updates, the team follows the progress of major international climate experiments, such as CMIP, or those carried out using the Canadian Regional Climate Model. The needs expressed by users are also taken into account.
The added value of Climate Portraits for Quebec
There are several high-quality climate platforms, but Climate Portraits was designed by and for Quebec. Its added value is that it is tailored to our local adaptation processes.
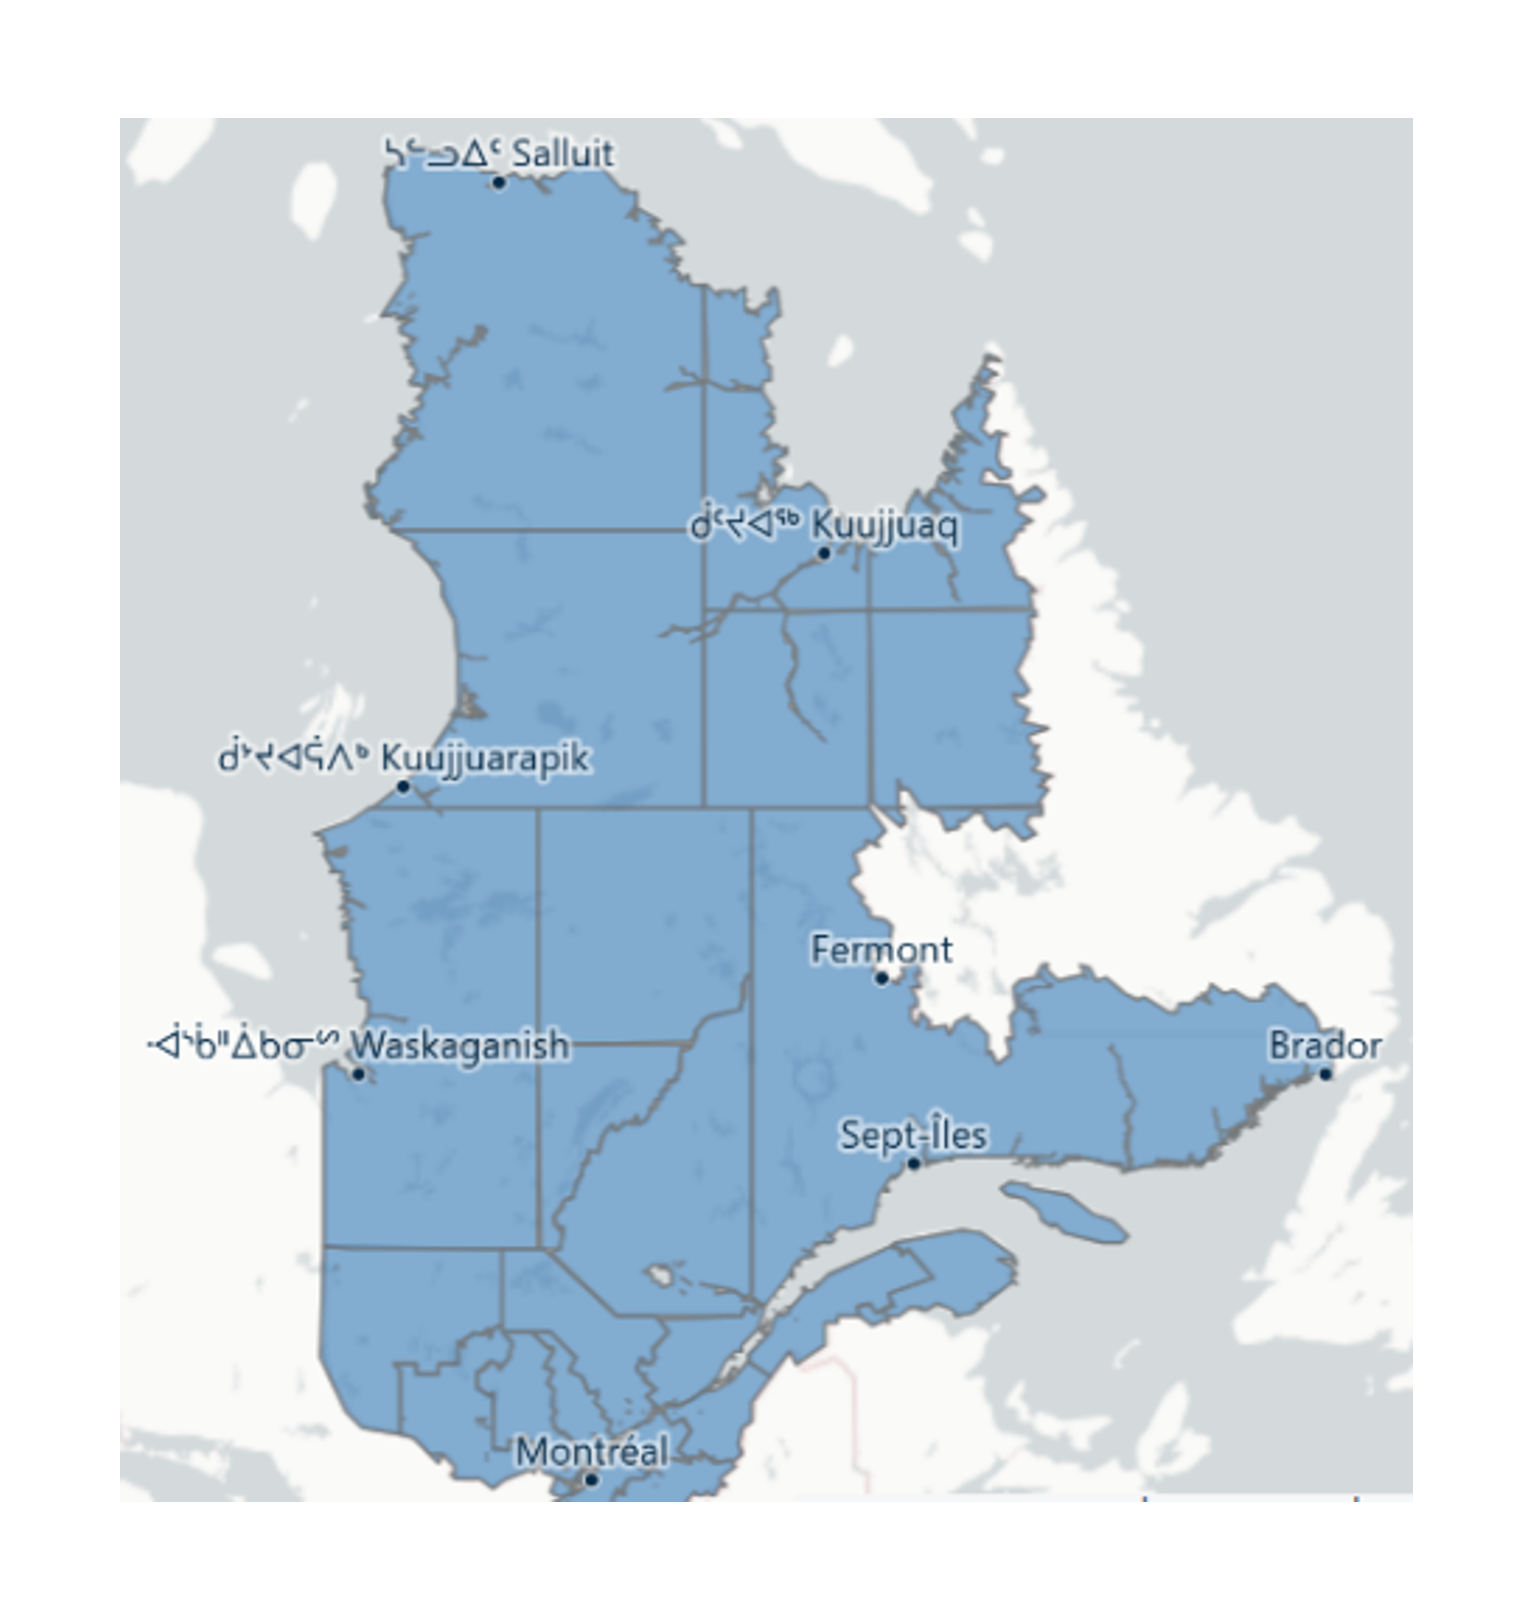
In particular, the platform enables the exploration of projections at the scale of administrative regions, RCMs, and even Indigenous lands in the north, which makes the information more useful for assessing climate risks at a local scale.
The indicators were also chosen in consultation with various partners across the province. For example, the definition of a heat wave is based on the thresholds established by the Institut national de santé publique du Québec.
The experts behind the platform’s development
The Ouranos Climate Platforms, Data and Operations and Climate Scenarios and Services teams are behind the Climate Portraits. Around ten specialists with varied backgrounds—software and web development, data science, climate and Earth sciences, communications—work together. With the creation of Climate Portraits, they have achieved their goal of providing a common, accessible, reliable tool to democratize access to climate projections across Quebec.
Visualize and analyze past, present, and future climate trends with our platform, which provides spatial information on the territory of Quebec.