
Understanding Climate Change
The climate of our planet is influenced by several natural factors, such as major volcanic eruptions, ocean currents and variations in solar energy. However, human activities such as the use of fossil fuels, agriculture and industrial activities, etc, are causing an increase in the concentration of greenhouse gases in the atmosphere.
Ever since the industrial revolution, this cause of climate warming has been 50 times more powerful than natural phenomena, acting with record speed compared to the last 2000 years. Thus, despite the presence of natural factors that influence the climate, there would probably be no global warming currently if it were not for human activities, as demonstrated by the figure below, from the Intergovernmental Panel on Climate Change.
Change in global surface temperature (annual averages) observed and simulated using human and natural factors
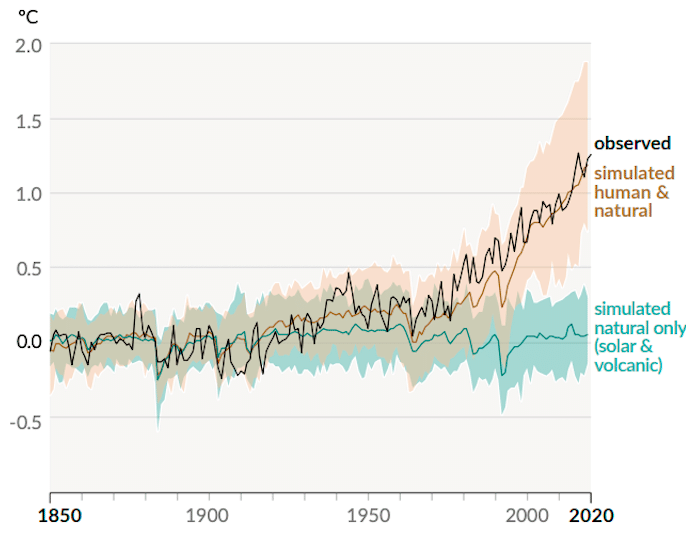
Figure 1. Change in global surface temperature observed over the last 170 years (black line) compared to the period from 1850 to 1900. Temperature change simulated by including human and natural factors (brown line) and by including only natural factors like solar and volcanic activity (blue line). The lines in the centre of the brown and blue areas indicate the average of the simulations. Source: IPCC (2021).
What is climate change?
Climate change refers to lasting changes in average weather conditions, extremes and variability. These changes are observed over long periods of time and generally persist for decades or more. Climate change is leading to a long-term increase in global temperatures and sea levels, as well as changes in the intensity and frequency of certain extreme events such as storms, heat waves and forest fires.
Source : climatedata.ca
The greenhouse effect
The sun is Earth’s source of energy. It emits the kind of energy known as solar radiation. Part of that energy—about one third—is reflected into space by the Earth’s atmosphere. The other part is absorbed by the earth’s surface and warms it.
However, excess heat that the Earth cannot absorb is reflected back in the form of infrared radiation, a long-wavelength type of energy. Greenhouse gases (GHGs), which naturally occur in the Earth’s atmosphere, act like a blanket and trap the infrared rays bouncing back from the Earth, creating heat in the atmosphere.
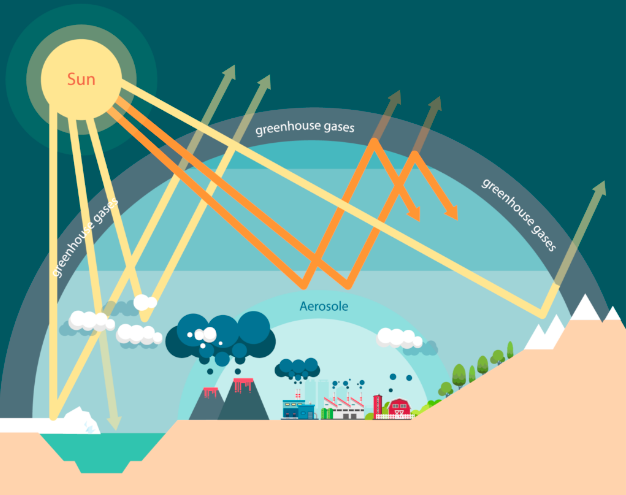
Figure 2. Greenhouse effect
Source : climatedata.ca
However, since the beginning of the industrial age, GHG concentrations in the atmosphere have risen dramatically due to the use of fossil fuels such as oil, natural gas and coal. This increase, mainly in CO2, retains part of the energy returned by the Earth, which causes excessive warming of the climate. In other words, the “blanket” is getting thicker. This phenomenon is even more troubling because some of these gases have a long lifetime and will influence the climate for many years to come. Global warming is partly attenuated by the rise in atmospheric aerosols, which, in contrast, have a cooling effect on the climate. But this is not enough to cancel out the strong warming effect caused by GHGs.
Global warming
Since the beginning of the industrial age, the use of fossil fuels, such as oil, natural gas and coal, has caused a considerable increase in GHG concentrations in the atmosphere. This increase, mainly of CO2, is thickening the GHG layer and increasing the greenhouse effect, causing excessive climate warming. This is particularly worrying because the long lifespan of some of these gases guarantees a lasting influence on the climate for many years to come.
The complex role of aerosols
In fact, global warming is partially curbed by the rise in aerosols in the atmosphere, which generate a climate cooling effect. These suspended particles absorb and diffuse some of the solar radiation out into space, preventing this energy from reaching the atmosphere or the Earth’s surface. However, this effect is not enough to offset the exponential warming associated with human GHG emissions. Although aerosols have a climate-cooling effect, they pose a real danger to human health and their impact is too minimal to slow down climate change.
Aerosols:
These are small suspended particles that are naturally present in the atmosphere (forest fire smoke, gases emitted by volcanoes, marine and ocean spray, etc.). Aerosols are also emitted by humans and are in fact air pollutants (vehicle emissions, industrial smokestacks, coal-fired power plants, microplastics, etc.). In urban areas, they often give rise to photochemical smog that causes problems for human health.
The scientific consensus
Since 1988, the Intergovernmental Panel on Climate Change (IPCC) has been assessing the available scientific information related to climate change in an unbiased and methodical manner. This information is drawn from studies published in scientific journals by experts in the field. The IPCC also works to identify elements that are the subject of a consensus among the entire scientific community.
Summary reports on the results are regularly published. In 2021, the IPCC published a report stating unequivocally that human influence has warmed the atmosphere, ocean and land and that changes in extreme events such as heat waves, heavy precipitation and droughts can already be attributed to it.
The consensus extends to related sciences: cryosphere analysis, hydrology, oceanography, geography and many others. The analysis of the results published in scientific articles reveals that more than 99% of these researchers agree that the planet is warming and that humans are the cause.
What is natural climate variability?
The climate exhibits natural variations, at different time scales. This is distinct from climate change. These fluctuations arise from interactions between the atmosphere, oceans, land and ice.
This is the variability within a year that gives rise to the seasons (summer, fall, winter, spring).
This corresponds to fluctuations in climate from one year to another (Figure 3, left panel). Annual variability explains the overall temperature differences from year to year, regardless of the trend of global warming.
For example, some years may be warmer or colder than others due to short-lived climate events, such as El Niño, La Niña or solar activity. These oceanic and atmospheric oscillations influence the global climate, changing temperatures and precipitation patterns on several continents for several months to a few years.
This refers to events that occur cyclically over periods of 10 to 30 years (Figure 3, middle panel). These include the North Atlantic Oscillation (NAO) and the Pacific Decadal Oscillation (PDO), which are patterns seen over the course of around twenty years. These phenomena are essential to understanding regional climates.
For example, the NAO affects winter temperatures and precipitation as well as the depth of the snow cover in Quebec. It causes more temperature instability in the north than the south, and this is particularly noticeable in seasons other than summer.
Decadal variability can also be influenced by one-time events. For example, large volcanic eruptions have the potential to cool the climate for a few years or even decades. During an eruption, large amounts of particles are spewed into the atmosphere. These spread rapidly over the entire surface of the globe, influencing the climate at the same time.
Importance of a historical perspective (30 years)
These large-scale natural variations can be misleading, as they decrease or amplify the trend of global warming over a long period of time.
That’s why it’s important to use at least 30 years of climate data. It’s essential to distinguish between cycles of natural variability and climate change. (Figure 3, right panel).
The regional dimension of natural climate variability
Natural variability is also expressed regionally. Natural phenomena that influence the climate over a year or a few decades do not influence the climate in the same way from one region of the world to another. For example, in Quebec and Canada, El Niño often results in milder, less snowy winters. Conversely, it often causes heavy rainfall in South America.
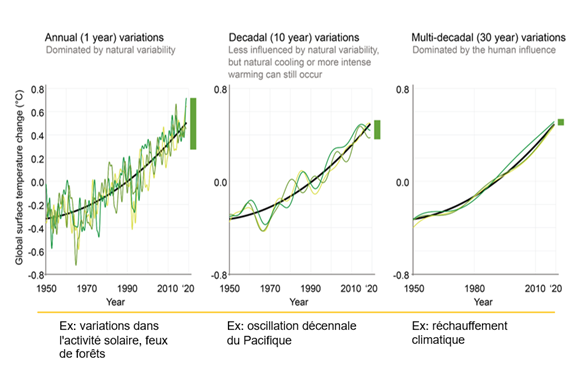
Figure 3: Annual and decadal variability compared to the climate change signal.
For more information on climate concepts:
