
Understanding Climate Change
Temperatures
Significant temperature increases all across Quebec are expected through to the end of the century (Figure 1). For the next 30 years, these temperature increases are similar in all greenhouse gas emissions scenarios.
As with the observed trends, the climate models project differences depending on the region. There is more marked warming in northern Quebec than in the south of the province.
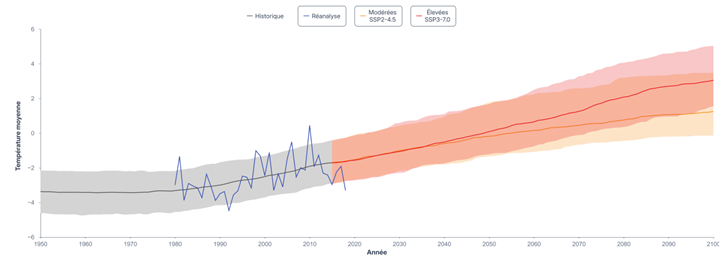
Figure 1: Change in average annual temperatures throughout Quebec from 1950 to 2100. The left part shows the past climate as simulated by an ensemble of climate models (grey area) and historical observations (blue line). The right part shows the climate projected by the ensemble of models. SSP2-4.5 is a moderate GHG emissions scenario; SSP3-7.0 is a high emissions scenario. From the Ouranos Climate Portraits, based on CMIP6.
Projections for a high emissions scenario:
In northern Quebec, average annual temperatures could rise by 2 to 3 °C by mid-century and by 4 to 6 °C by the end of the century.
In southern Quebec, average annual temperatures could rise by 2 to 3° C by mid-century and by 4 to 5°C by the end of the century.
*Anticipated changes are relative to the historical reference period of 1991-2020.
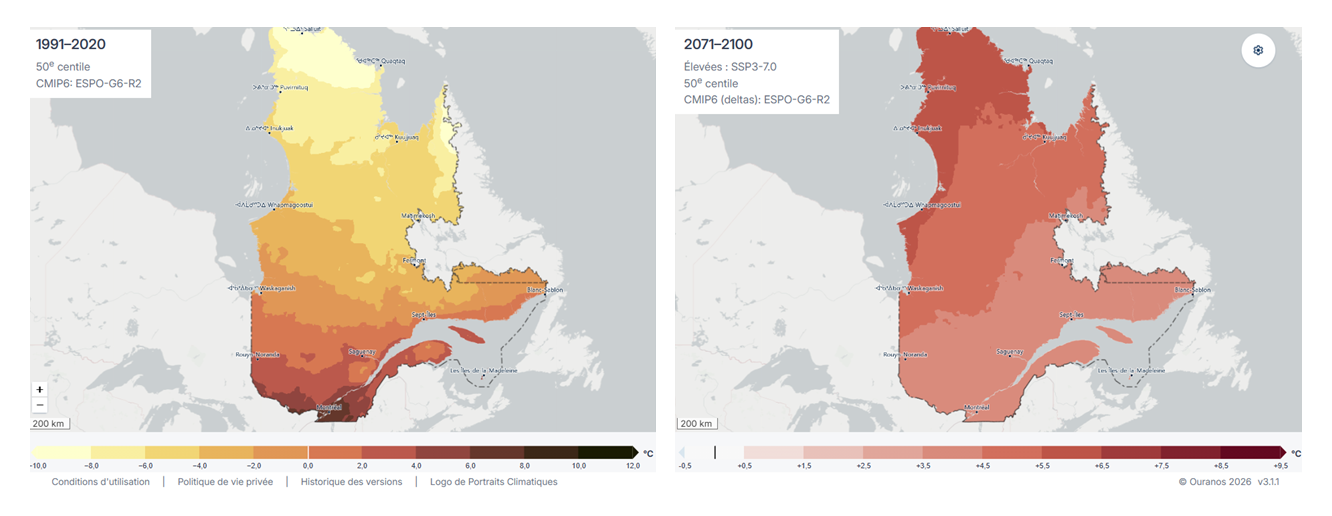
Figure 2: Average annual temperatures (°C) for the historical period 1991-2020 (left panel) and projected changes (°C) for the future period 2071-2100 (right panel), with a high emissions scenario (SSP3-7.0). Source: Ouranos Climate Portraits, 2026.
Summer temperature
During the summer months, increased temperatures will result in a greater frequency of heat waves, particularly in the southern part of the province. This trend is consistent with various important studies, including work by the Intergovernmental Panel on Climate Change (Figure 3).
For example, in the Outaouais, where the maximum regional temperature has exceeded 30 °C for about three days per year during the last few decades, it could happen up to 25 days per year in 2050 and 50 days in 2080, which corresponds to nearly a month and a half per year.
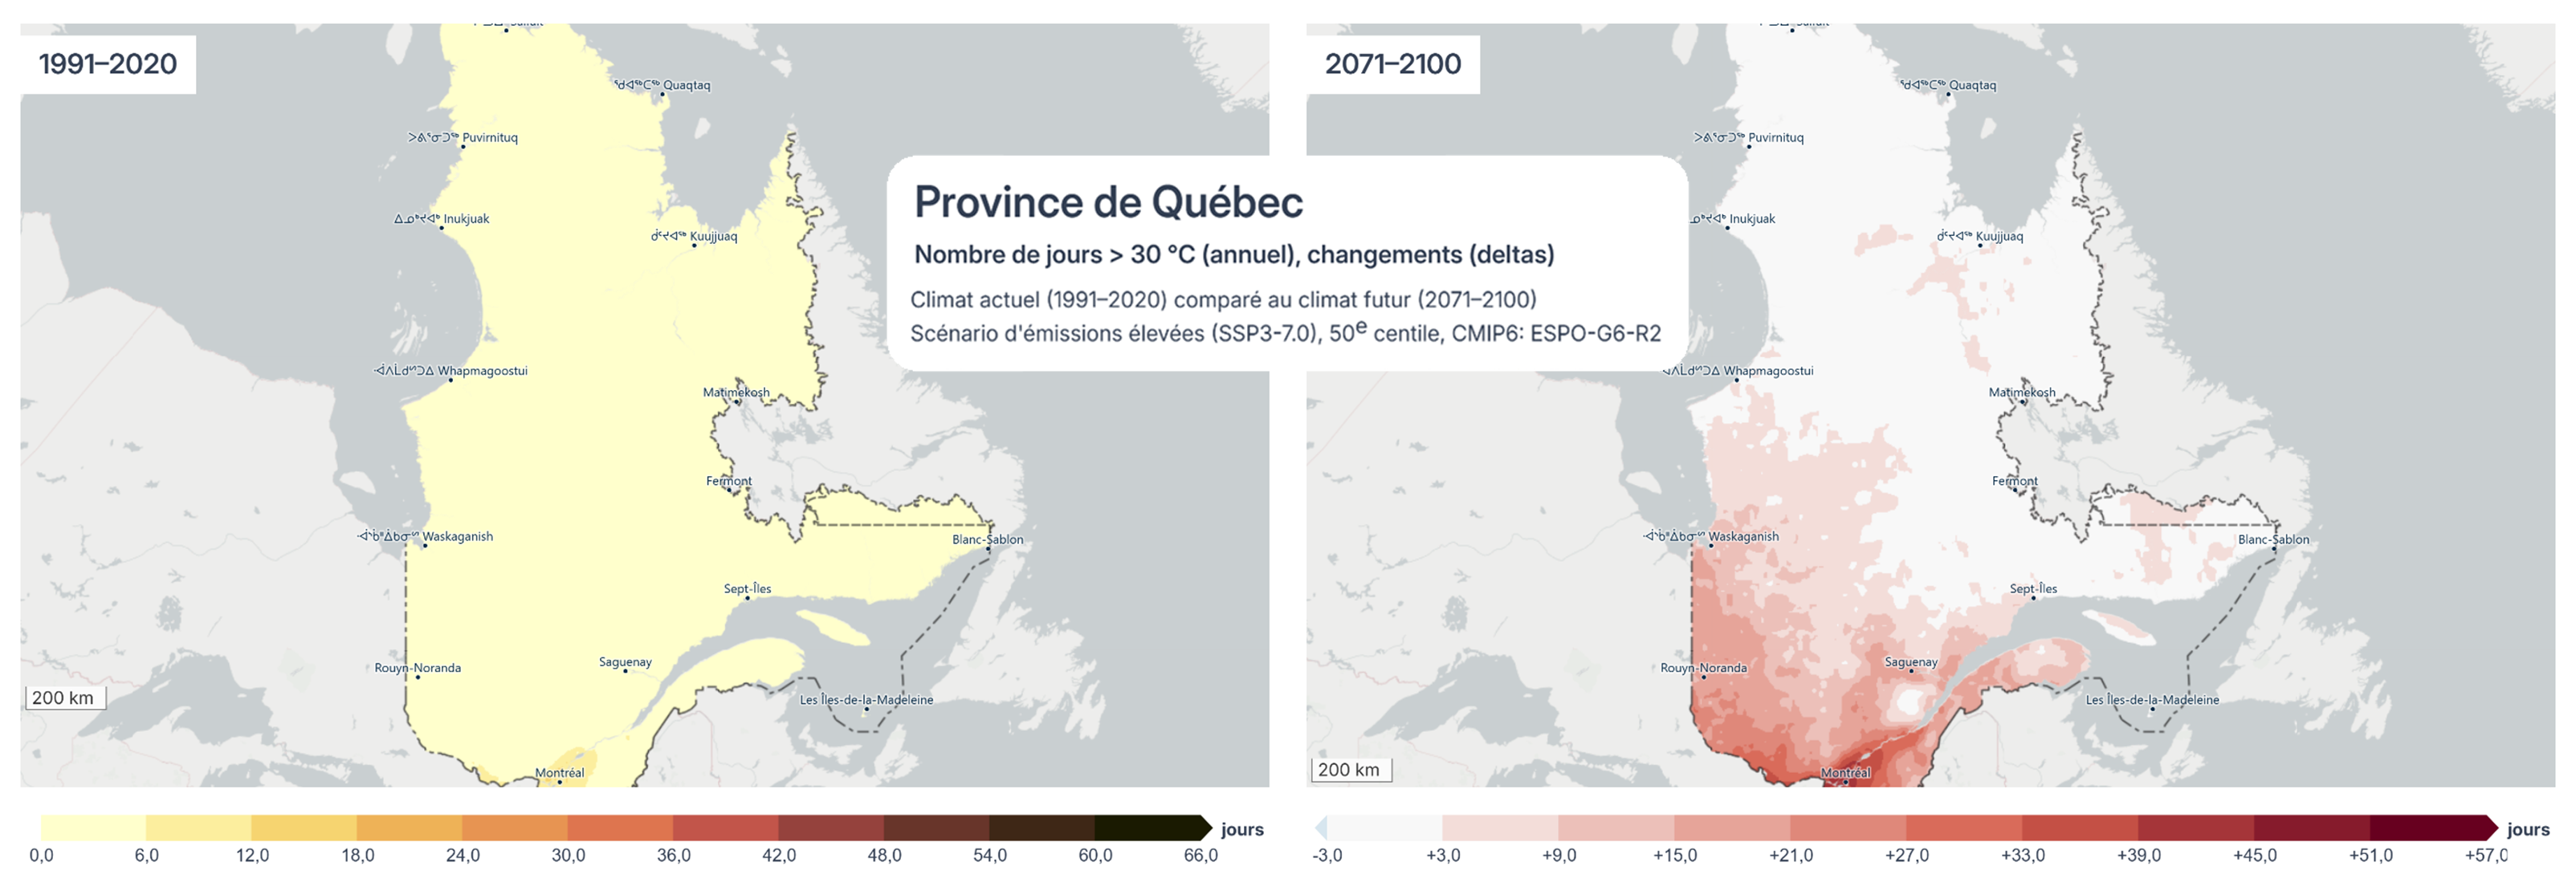
Figure 3: Annual number of days with a maximum temperature above 30 °C for the historical period 1991-2020 (left panel) and projected changes for the future period 2071-2100 (right panel), with a high emissions scenario (SSP3-7.0). Sources: Ouranos Climate Portraits, 2026.
TWinter temperatures
Winter temperatures are also on the rise, more markedly in the north of the province, with increases reaching 8 to 13 °C on average annually by the end of the century under a high greenhouse gas emissions scenario (Figure 4).

Figure 4: Average winter temperatures (°C) for the historical period 1991-2020 (left panel) and projected changes (°C) for the future period 2071-2100 (right panel), with a high emissions scenario (SSP3-7.0). Sources: Ouranos Climate Portraits, 2026.
Freeze-thaw events continue to show a slight downward trend, as observed on an annual basis all over Quebec. However, there are nuances depending on the season, especially during the winter in the regions further south, where the number of freeze-thaw days will increase.
Precipitation
Global warming is having an impact on precipitation patterns by accelerating the water cycle. A warmer atmosphere generates more evaporation and can hold more vapour, which leads to increased precipitation in some areas. For Quebec as a whole, an increase in annual total precipitation (rain and snow) of 11% to 16% is expected by the end of the century, depending on moderate and high GHG emission scenarios.
However, this trend hides significant regional and seasonal disparities. A greater relative increase in total precipitation is expected in northern Quebec compared to southern Quebec. This does not mean that the north will receive larger amounts of rain than the south, but that the relative increase will be greater, as precipitation levels are historically lower there compared to other regions.
The increases in total precipitation will be greatest in winter, spring and fall, while projections indicate smaller increases in the summer, or no changes in the southwest of the province.
Projections for a high emissions scenario:
In northern Quebec, the average annual total precipitation could increase by 9 to 12% by mid-century and by 16 to 28% by the end of the century.
In southern Quebec, the average annual total precipitation could increase by 7 to 10% by mid-century and by 11 to 16% by the end of the century.
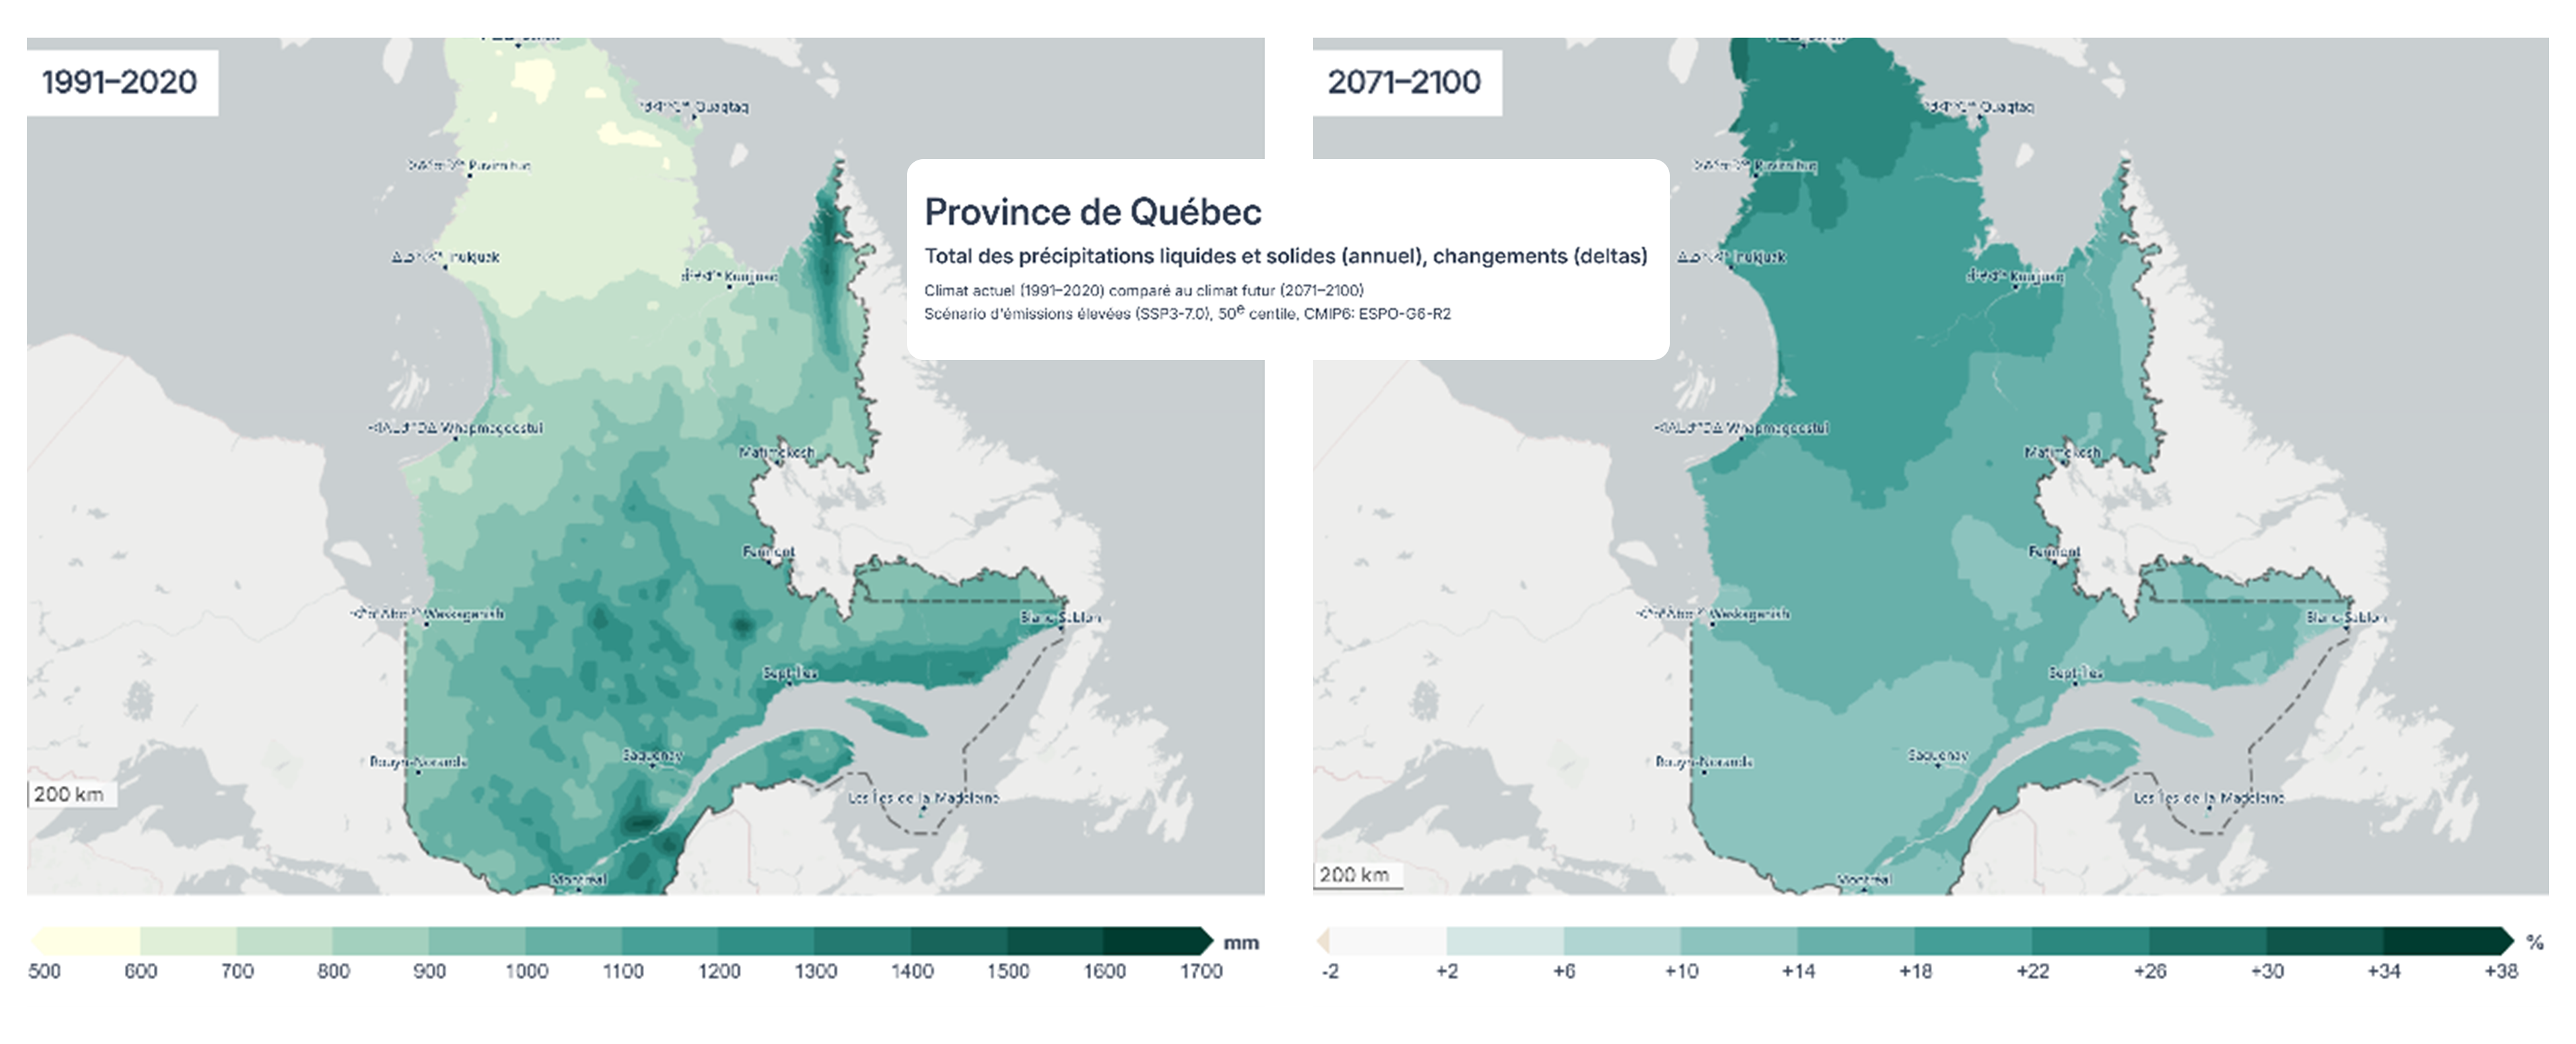
Figure 5: Total precipitation (mm) for the period 1991-2020 (left panel) and projected changes (%) for the period 2071-2100 (right panel) for a high emissions scenario (SSP3-7.0). Source: Ouranos Climate Portraits, 2026.
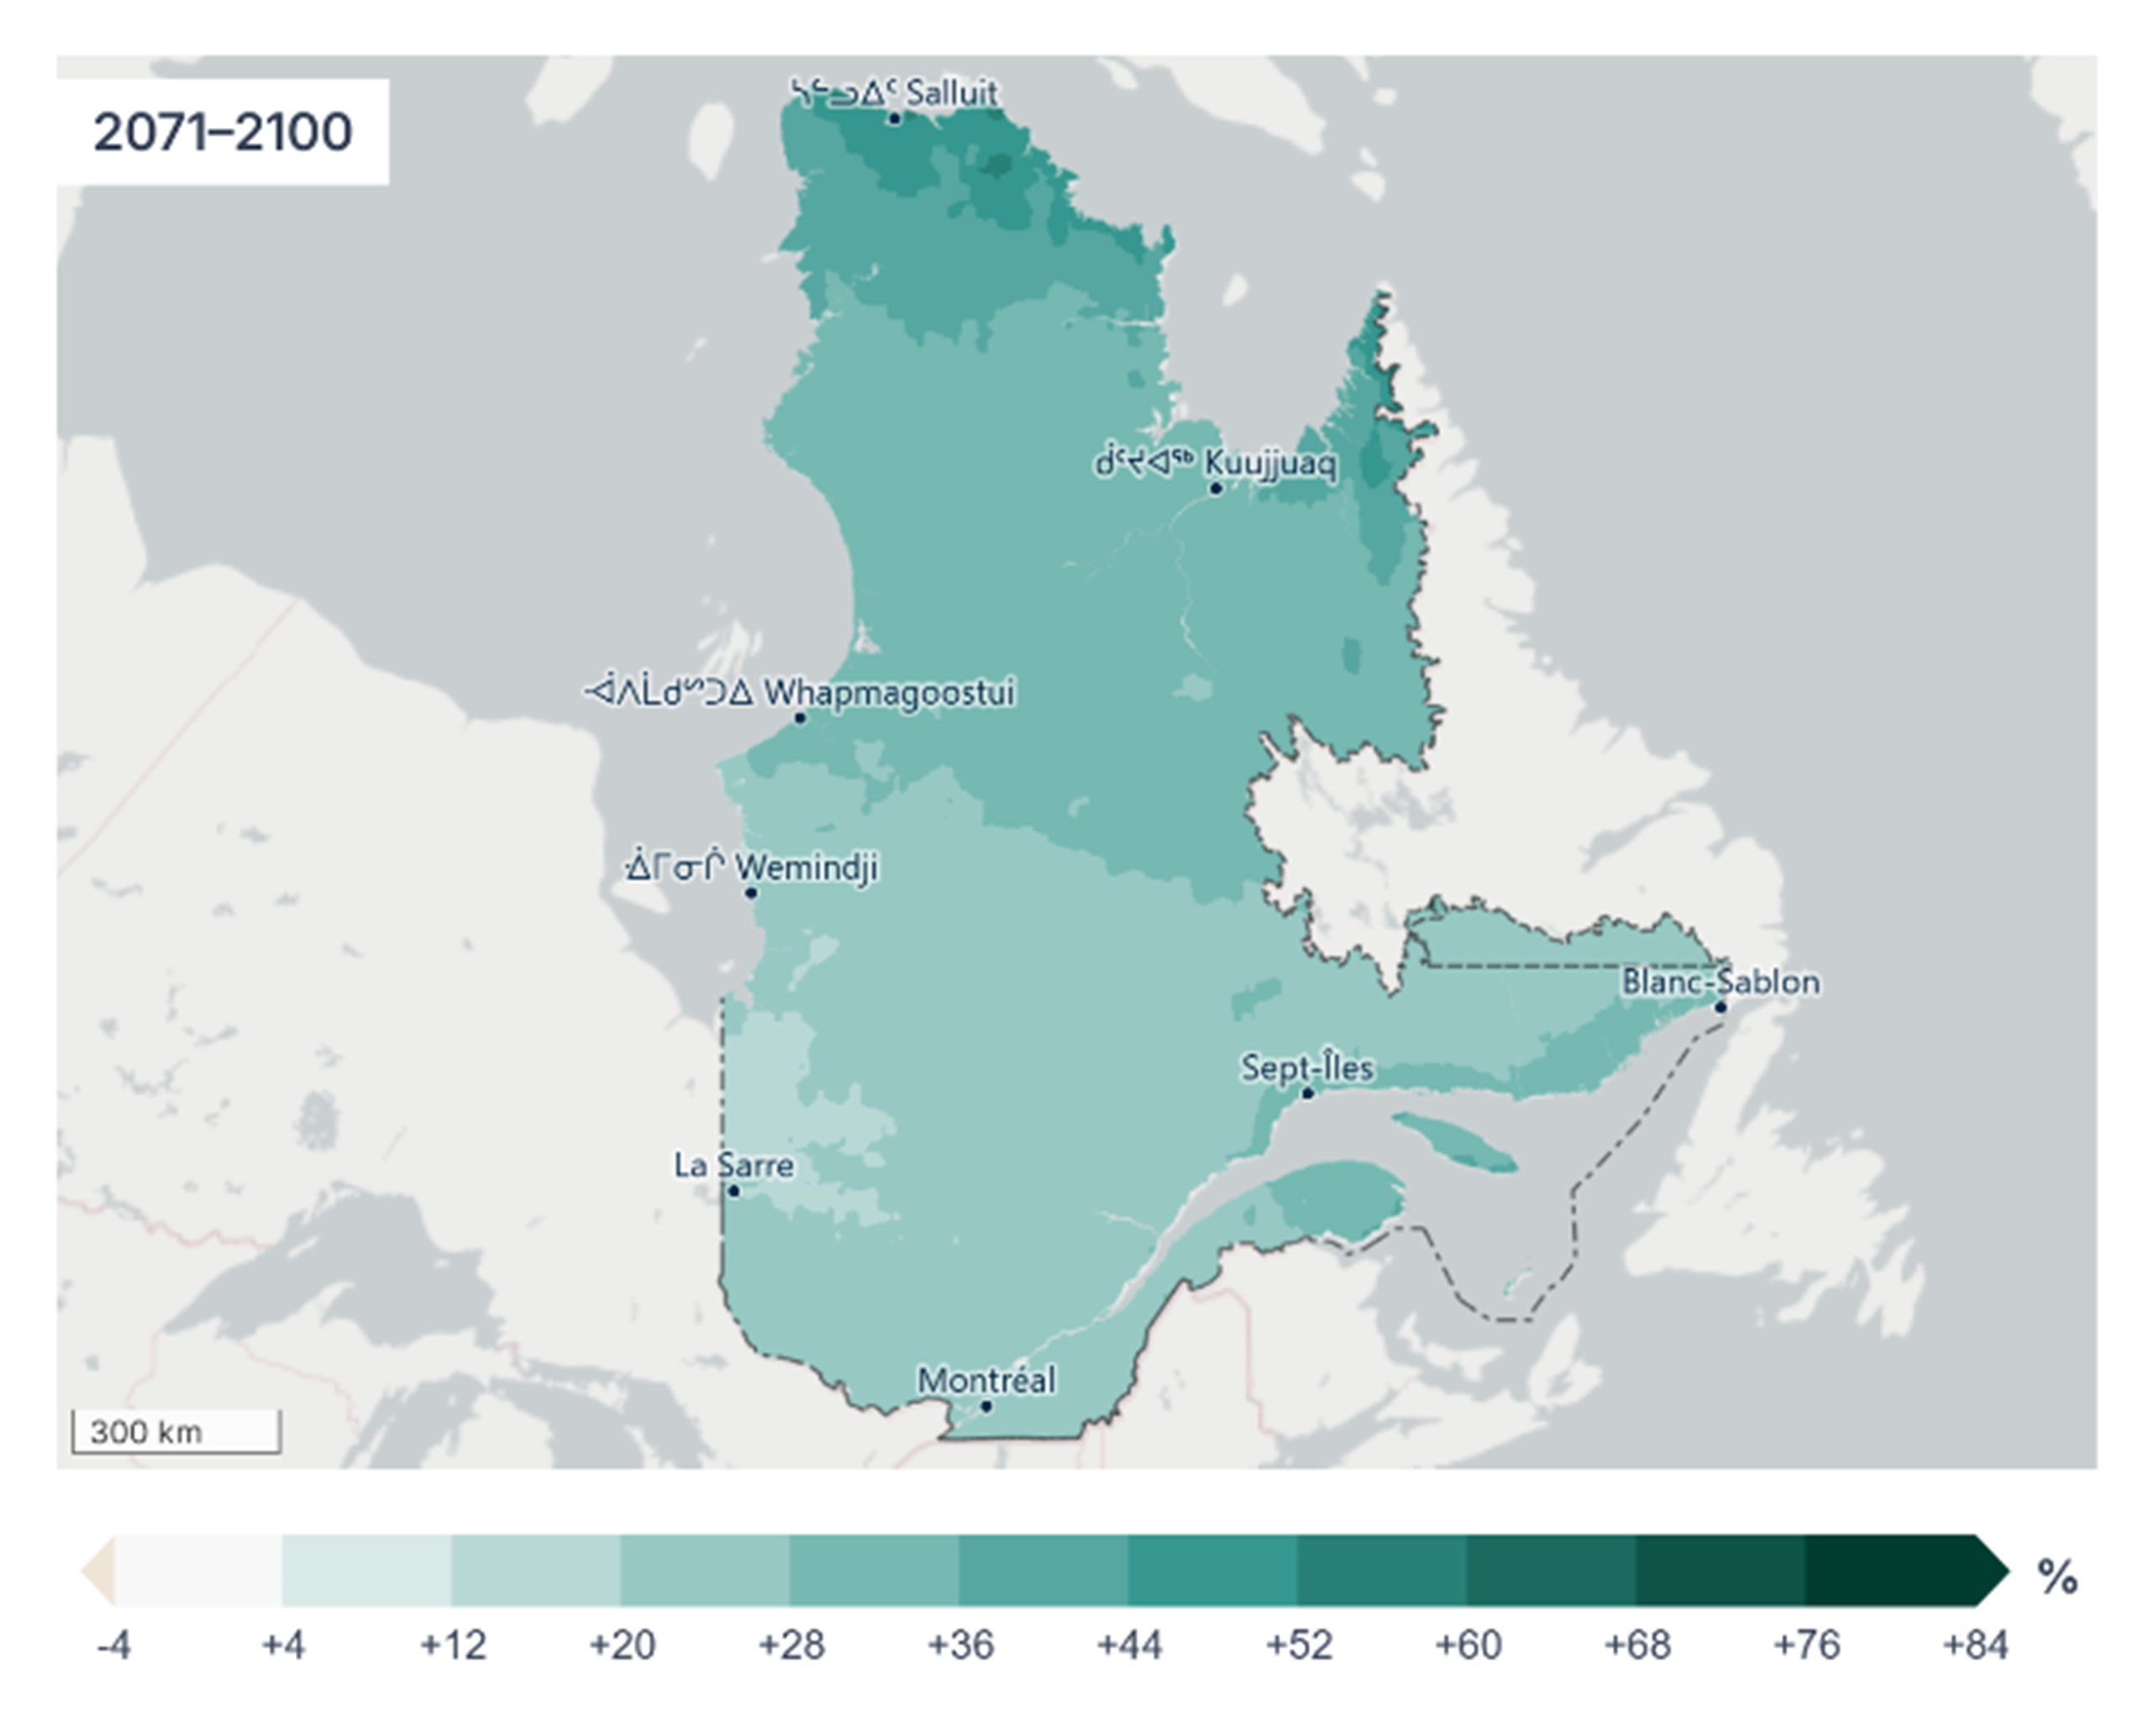
Figure 6: Projected change in average annual liquid precipitation (%) for the future period 2071-2100 compared to 1991-2020 with a high emissions scenario (SSP3-7.0). Source: Climate portraits, 2026.
Liquid versus solid precipitation
Trends associated with total precipitation also hide differences between rain and snowfall. The projected increase is mainly in the liquid precipitation portion of the total precipitation. It is quite marked throughout the province, with greater relative changes in the north than in the south (Figure 6).
In terms of annual solid precipitation, a decrease is expected in southern Quebec and an increase in the extreme north of Quebec, with an area with little change in between (Figure 7, left). However, in the winter, the increases are much greater starting from the 50th parallel and values increase gradually northward (Figure 7, right).
In the south, decreases in solid precipitation are expected, even in winter. This is mainly due to higher temperatures, which are causing an earlier change in the state of precipitation (from snow to rain). This change in state has impacts on water management and hydrology, including earlier spring flooding and flood risks that will persist later in the fall, as well as affecting all winter activities in the south of the province.
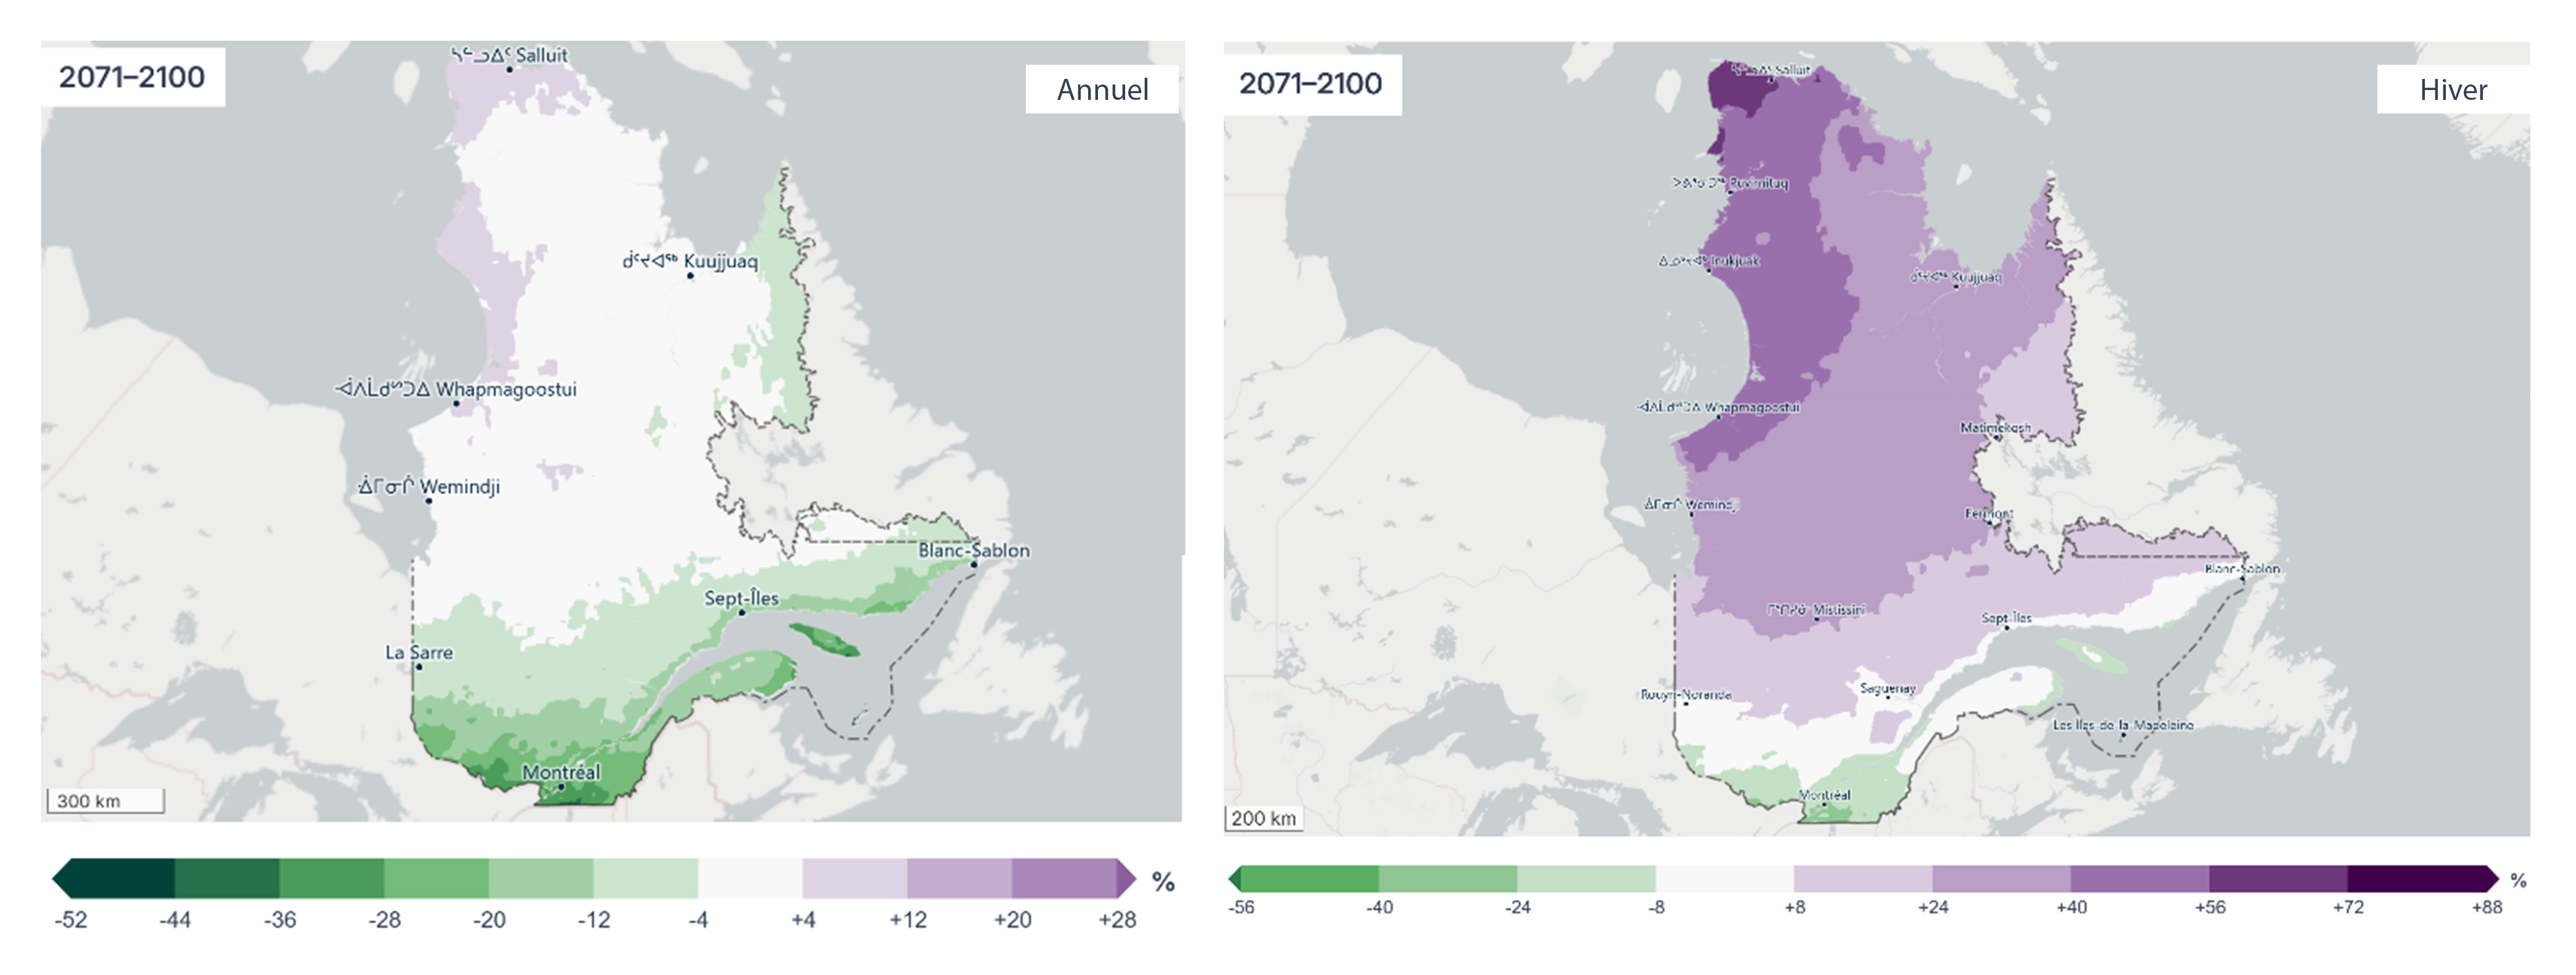
Figure 7: Projected change (%) in average annual solid precipitation (left) and average solid precipitation in winter (right) for the future period 2071-2100 compared to 1991-2020, with a high emissions scenario (SSP3-7.0). Source: Climate portraits, 2026.
Extreme rainfall and adaptation
All regions of Quebec will experience significant increases in all indices of heavy and extreme precipitation, in terms of both quantity and frequency. For example, the number of days with precipitation above 20 mm in one day will increase for the province as a whole. This effect is more pronounced in the south of the province, with an increase of nearly four days for some areas. Similarly, the amount of rain accumulation over five days could increase by 12% on average across the province by 2050 under a high emissions scenario.
This will inevitably have repercussions on the extent and frequency of floods and droughts and will impact the built environment, hydroelectricity generation, urban drainage and various water uses if adaptation actions are not taken.
That means that using past climate data to plan long-term precipitation management is no longer appropriate. The use of climate projections has clearly become a necessity.
View and access climate indices in the historical climate and the future climate
The Ouranos Climate Portraits offer interactive graphic representations of the changes in temperatures and precipitation projected throughout Quebec on an annual and seasonal basis. You can view and download maps, figures and tables for all of Quebec or by administrative region.
The website ClimateData.ca, from Canadian Centre for Climate Services, provides access to indices and enables customized thresholds to be set for specific needs.
