
Understanding Climate Change
The next generations of Quebecers will live in very different climate conditions from what their elders experienced. It is now understood that increases in greenhouse gas concentrations act directly on Earth’s temperature, which is gradually rising.
Analyses of the data observed over the past decades are underway and will help to clarify past trends in precipitation and temperatures.
Variables are data measured directly in the environment or simulated by a climate model at a specific time. They include various meteorological variables such as temperature, wind speed, precipitation, humidity and atmospheric pressure.
Meteorological variables are observations that describe weather conditions at a given time. When we speak of climate variables, on the other hand, we are referring to this raw data being studied over the longer term.
Climate indicators are derived from climate variables to reflect changes in various climate phenomena over time. For example, they track the average annual temperature, the number of days above 32°C, or the number of days without frost. Their role is to simplify our understanding of climate trends and make it objective, thereby facilitating public decision-making, research and communication.
Some complex climate phenomena involve a combination of several climate variables at once. For example, changes in meteorological drought (a climate-related phenomenon) are generally expressed in terms of the Standardized Precipitation Evapotranspiration Index (SPEI), an indicator derived from precipitation and atmospheric humidity variables.
While these climate variables are primarily used to describe the weather, they are also required inputs for the study of changes in climate conditions over the long term through precise climate indicators.
A climate normal is an average value of a climate variable, calculated from observations over a 30-year historical time interval, that defines the “typical” climate conditions of a given region.
List of remarkable Quebec climate events
The Quebec climate archives, maintained by the Ministère de l’Environnement et de la Lutte contre les changements climatiques, date back to 1870 and make it possible to identify the province’s significant climate-related events. Since 2013, the ministry has published key climate-related events on a monthly and annual basis, consisting of phenomena related to temperature, precipitation, snow cover, storms, etc. In recent years, records have often been reached or broken, especially for average temperature and extreme heat.
Temperatures
2024 was the warmest year on record in Quebec, with an average temperature 3.9 °C above the twentieth century normal. 2025 was the sixth warmest year.
In comparison, 2024 was the warmest year on record worldwide in 175 years, at 1.5 °C above the pre-industrial average (1850-1900).
In recent years, Quebec and the Atlantic provinces have experienced lower average annual temperature increases than the rest of Canada. Between 1948 and 2024, the average annual Canadian temperature increased by 2.4 °C, while in Quebec, the increase since 1915 was 1.9 °C (Figure 1).
This discrepancy is partly explained by the major natural oscillations that cause the climate on the North American continent to vary from coast to coast (see Background section). These oscillations are responsible for the more rapid warming in western Canada during the second half of the twentieth century.
Accelerated warming in the north
Nationally, Canada’s average annual temperature has risen nearly twice the global average. However, this increase is not uniform: the warming is much greater in the north than in the south of the country.
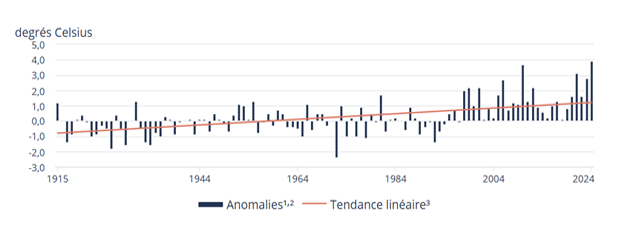
Figure 1: Temperature anomalies observed in Quebec from 1915 to 2024, from the archives of the Réseau de surveillance du climat du Québec. Source: Ministère de l’Environnement, de la lutte contre les changements climatiques, de la Faune et des Parcs (MELCCFP)
These overviews provide more information on observed changes in temperature:
In northern Canada, annual temperatures have risen about three times faster than the rate of global warming. This also applies to Quebec: although average temperatures have increased throughout the province, the trend is more pronounced in the northern part (Figure 2).
Seasonal changes
For Quebec as a whole, very hot temperatures in the summer increased, both during the day and at night. The frost-free season and the agricultural growing season have been extended by almost a month. In addition to a longer and warmer autumn, winters are shorter and less cold, with warmer winter temperatures day and night. Along with longer and warmer autumns, shorter and less cold winters are seen. The coldest temperatures in winter are higher for both day and night. And the annual number of days with freeze/thaw events is decreasing.
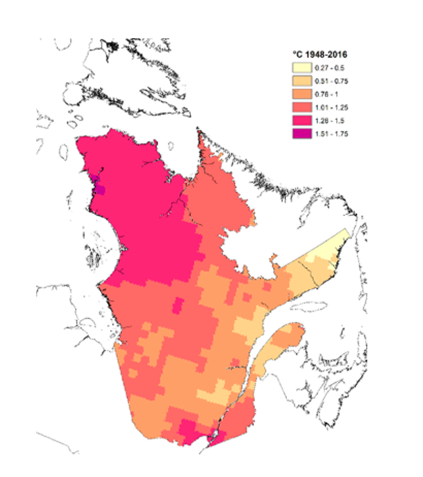
Figure 2: Observed increases (°C) in average annual temperatures in Quebec between 1948 and 2016. Source: Adapted from Figure 2 in Vincent et al., 2015.
But why is the north warming faster?
One of the main reasons is the reduction in albedo. Snow and ice reflect much of the incoming solar radiation, while water absorbs most of it.
With global warming, the amount of snow and ice covering the Earth is decreasing, reducing this reflection (the albedo effect). Darker land and water surfaces absorb more incident solar radiation, adding more heat to the climate system. Through this feedback loop, global warming is amplified as the initial snow and ice cover decreases.
The excess solar energy absorbed by the oceans also slows down the formation of surface ice. This situation makes the winter freeze happen later.
Precipitation
Quebec benefits from abundant precipitation, which varies widely across the province. The vast corridor along the St. Lawrence Valley receives the largest amounts, with accumulations exceeding 1000 mm/year, while Nunavik receives about half, or 500 mm/year.
Between 1948 and 2012, the average annual precipitation increased by 10.5% province-wide. The increases are greater in the north, reaching 35%. In southern Quebec, they are limited to between 5 and 15%. Conversely, some areas, such as the James Bay area, show no changes or a slight decrease (Figure 3).
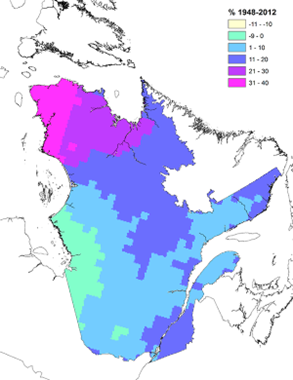
Figure 3: Observed changes (%) in total annual precipitation in Quebec from 1948 to 2012 based on linear trends. Source: Adapted from Figure 4 in Vincent et al., 2015.
Seasonal changes and the decrease in snow
On a seasonal basis, between 1948 and 2012, average increases across the province were highest in the spring and fall (about 20%) and lowest in the summer and winter (about 6%). Seasonal decreases were also noted in a few regions, particularly in the winter in the southeast of the province and in the spring and summer around James Bay.
What’s more, precipitation in the form of snow rather than rain has decreased in recent decades. These reductions were greater in the spring and fall, mainly due to warming during these two seasons.
Analysis of precipitation indicators
Various precipitation indicators have been analyzed to describe the changes in precipitation that have been observed. Between 1948 and 2012, the number of days of intense rain increased significantly in Quebec.
Other indicators, such as the number of rainy days and the maximum amount of rain and snow in one day, have increased slightly, while the number of days with snowfall has slightly decreased. For Canada as a whole, there is no available observational evidence of changes in the amounts of extreme precipitation accumulated over a period of one day or less.
