
Understanding Climate Change
Climate models: Simulating the future
To simulate the future climate, climate scientists use climate models that aim to replicate the climate system and its physical interactions in the atmosphere, oceans and ice and the Earth’s surface.
How the models work
Each component of the system is modelled by mathematical equations based on the laws of fluid mechanics.
Inputs: To carry out climate simulations, the models must be provided with the greenhouse gas (GHG) concentrations observed in the past and estimated over the next few decades. This makes it possible to see how GHGs influence the climate.
Results: Simulations generate virtual data at different points in space and time. These data are representations of the future climate in the context of changing GHG concentrations.
Utility: These data help us understand climate processes and support climate change adaptation and mitigation efforts.
The result of running the model on the past and the future is called a “climate simulation,” while a “climate projection” refers only to the future.
Two categories of climate models
There are two main categories of climate models. There are global climate models (GCMs), also known as “Earth system models.” They represent the climate across the globe and simulate it at a resolution of 100 to 250 km.
There are also regional climate models (RCMs), which focus on one part of the globe. This restricted perimeter allows them to offer finer resolution, between 10 and 50 km.
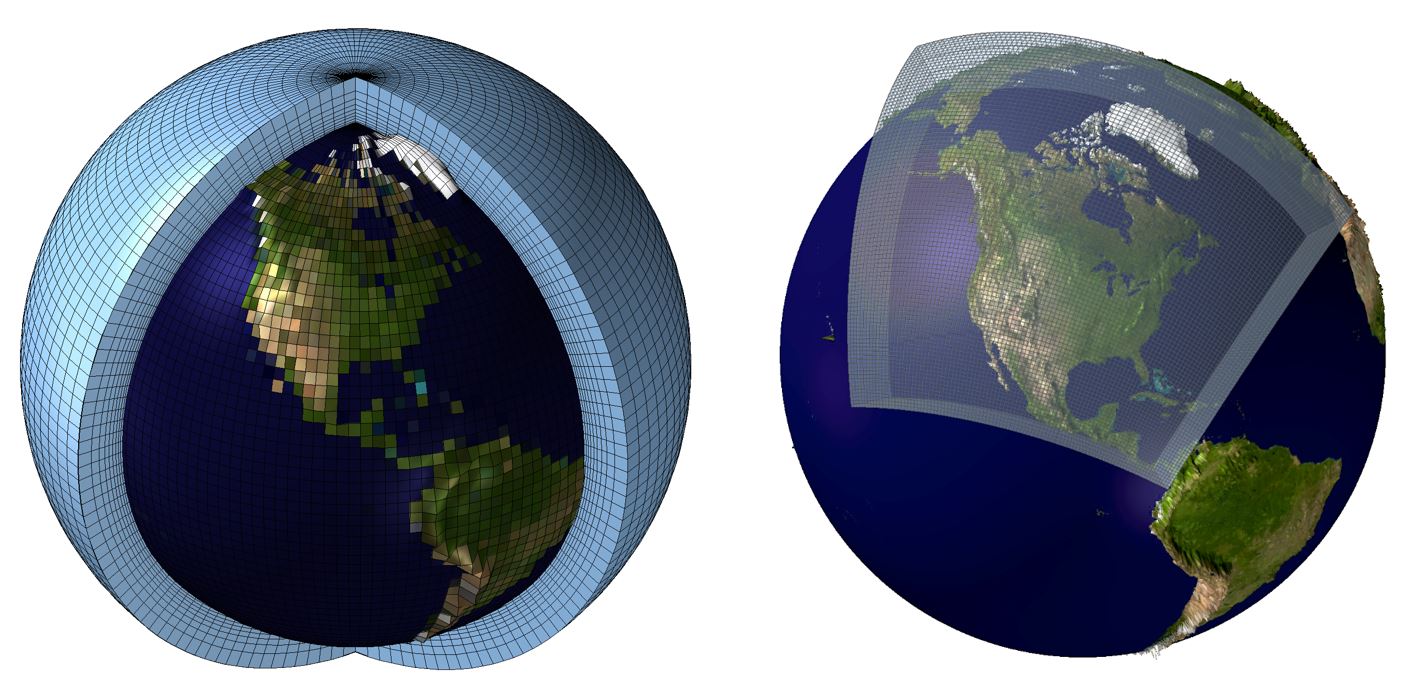
Figure 1. Diagram of a global climate model (left) | Diagram of a regional climate model (right)
A global research effort: CMIP
Some fifty organizations around the world are developing climate models and providing simulation results in the public domain. This is part of the Coupled Model Intercomparison Project (CMIP), a global climate research program.
CMIP phases are renewed every 6 or 7 years.
This work forms the basis for the Intergovernmental Panel on Climate Change (IPCC) reports. The 6th IPCC report, published in 2021, is based on the 6th phase of CMIP (CMIP6). It’s an update of the 5th report, which was based on CMIP5.
The Canadian Regional Climate Model
Since 1991, UQAM and the Centre pour l’étude et la simulation du climat à l’échelle régionale (centre for regional climate studies and simulation) have collaborated with Environment and Climate Change Canada and other research centres to develop the Canadian Regional Climate Model (CRCM). Ouranos works with these centres and produces climate simulations using the CRCM. These simulations are usually done on North America.
Collaboration between organizations ensures high-level research. The results from the CRCM provide excellent climate information to improve the understanding of the North American climate and support adaptation to climate change, at fine spatial scales and for more complex phenomena.
Reliability through numbers: Multi-model ensembles
Each climate model gives different results, depending on its strengths and weaknesses. For example, some models simulate snow cover well, but may have weaknesses in simulating extreme precipitation.
It is therefore recommended to use several climate models from different sources to generate a more reliable description of the future climate. These grouped simulations are called multi-model ensembles.
Post-processing and model selection
Raw simulations produced by ensembles of models are often post-processed to make them usable for various purposes. Statistical methods are applied to the simulations to correct biases and to fit them to weather and climate observations.
Multi-model ensembles contain an exorbitant amount of data, so the most representative data depending on the context of the application must be selected. This reduces the number of simulations used, in order to limit calculations while ensuring adequate coverage of uncertainties.
The end result of this process is a data set that is representative of the plausible futures. The data provided must be user-friendly and contain climate indicators in keeping with the needs of users.
Greenhouse gas emissions scenarios: From RCPs to SSPs
Since the change in climate conditions depends on the current and future GHG content of the atmosphere, the use of concentration scenarios is essential in climate modelling in order to reflect the range of possibilities. These scenarios cover multiple GHG concentration trajectories since it is impossible to accurately predict how much will be emitted in the future. In each of its reports, the IPCC discusses climate change based on updated GHG concentration scenarios.
The RCP era: Radiative forcing
For its fifth report, published in its entirety in 2014, representative concentration pathways (RCPs) were used. The RCPs were characterized by radiative forcing values, a climatology term that refers to the difference between the energy received and the energy returned by the climate system.
As the concentration of GHGs increases, the greenhouse effect blocks the return of energy, resulting in an increase in radiative forcing and more disruption of the climate balance. For example, RCP4.5 and RCP8.5 quantified GHG concentrations reaching radiative forcing values of 4.5 W/m2 and 8.5 W/m2 in 2100.
To construct these scenarios, socioeconomic assumptions are made (e.g., population, education, urbanization, GDP). However, the assumptions used for RCPs were not standardized, making it difficult to associate them with climate targets, such as the Paris Agreement target of limiting global warming to 1.5°C.
Moving towards SSPs: Considering societal choices
The use of shared socioeconomic pathways (SSPs), adopted in the IPCC’s sixth report, which was completed in 2023, simplifies interpretation. SSPs are also used in CMIP6. For these GHG concentration scenarios, researchers quantify both future socioeconomic parameters and GHG emissions. That makes it possible to link a society’s choices, as outlined in the SSP narratives, to levels of global warming.
Understand the “SSPx-y” nomenclature
Common GHG scenarios are identified by the term “SSPx-y” where x is the narrative number and y refers to the radiative forcing reached in 2100, similar to the RCPs.
For example, SSP2-4.5 is based on SSP2, the middle of the road, with a radiative forcing value of 4.5 W/m2 in 2100.
However, caution should be exercised when comparing RCPs and SSPs. Although the radiative forcing values of RCPs and SSPs are similar at the end of the century, the progress of the GHG concentrations in the two generations of scenarios is completely distinct, as illustrated in the following figure. This is due to the trajectories that differ over time.
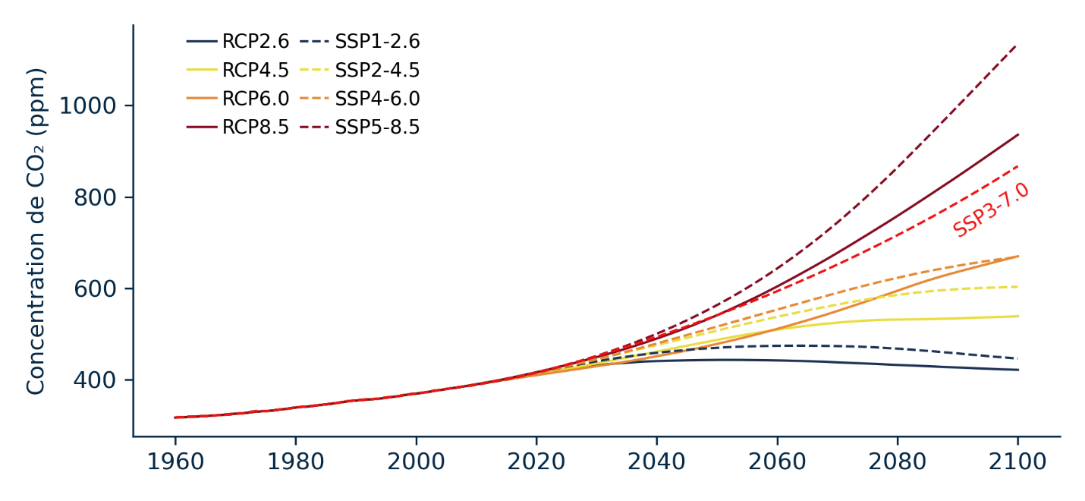
Figure 2. Change in annual CO2 concentrations in the RCP and SSP scenarios. Significant differences can be seen, especially in the case of RCP8.5 and SSP5-8.5. Source: Ouranos.
The scenarios prioritized by the IPCC
Five SSPs were prioritized in the IPCC’s sixth report. For each of them, global surface temperature changes were estimated using several climate models. The results are shown in the following figure.
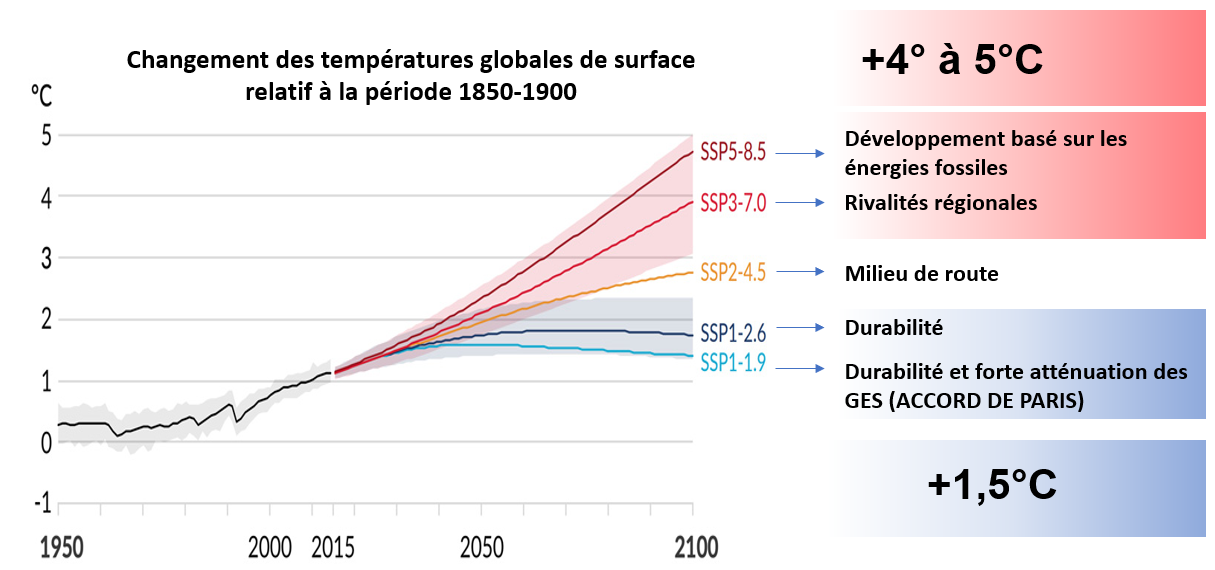
Figure 3. Change in global temperatures for the five SSPs. The coloured lines represent the average value of all climate models. The black line represents the average value of the historical simulations. The shaded areas represent the uncertainty envelope for SSP3-7.0 and SSP1-2.6. For clarity, the envelope is not shown for the other SSPs. Adapted from IPCC, 2021. Summary for policymakers.
The figure shows:
An increase in global temperature at least until mid-century, in all SSPs considered.
Global warming of 2°C being exceeded in the 21st century unless significant reductions in GHG emissions occur in the coming decades.
A divergence in the estimated temperature changes for each SSP, which accentuates over time.
Results that are clearly differentiated at the end of the century, with global warming reaching nearly 5°C with SSP5-8.5, while with SSP1-2.6, it remains below 2°C.
Selecting scenarios for adaptation strategies
The different SSP scenarios have a considerable range of possible future temperatures, and this range increases over time. When designing an adaptation measure, it is advisable to use at least two scenarios, since no consensus on rules to guide the choice of GHG scenarios has been established. In particular, this makes it possible to account for sensitivity to scenarios and to consider flexible adaptation solutions in the face of an uncertain future climate.
For climate change adaptation purposes, the most relevant and commonly used scenarios are known as Middle of the Road (SSP2) and Regional Rivalry (SSP3). In addition, the high emissions scenario (SSP5) can also be used for adaptation.
Although it is not considered the most likely scenario, it is useful in adaptation, in particular to assess the robustness of adaptation measures and to measure the resilience of certain infrastructure in an extreme climate or over the long term (such as post-2100).
Current social, economic and technological trends continue around the world. Development and income growth proceed unevenly, with some countries making relatively good progress while others fall short of expectations. Global and national institutions work toward but make slow progress in achieving sustainable development goals. The quality of the environment deteriorates, but some improvements are noticeable and, overall, the intensity of resource and energy use declines. Population growth is moderate and levels off the second half of the century. Challenges in reducing social and environmental vulnerability remain.
Resurgent nationalism, concerns about competitiveness and security, and regional conflicts push countries to close themselves off. Policies shift over time to become increasingly oriented toward national and regional issues. Countries focus on achieving their own domestic energy and food security goals at the expense of broader-based development. Little investment is made in education and technology. Economic development is slow, consumption is material-intensive, and inequalities worsen over time. Population growth is low in industrialized countries and high in developing countries. Environmental concerns are secondary, leading to severe environmental degradation in some regions.
Competitive markets, innovation and participatory societies are prioritized in order to produce rapid technological progress and development of human capital as the path to sustainable development. Global markets are increasingly integrated. There are strong investments in health, education, and institutions. The push for economic and social development is coupled with the exploitation of fossil fuel resources and the adoption of resource-intensive lifestyles. All of these factors lead to rapid growth of the global economy. Populations peak around 2050 and decline in the 21st century. Local environmental issues are successfully managed. There is faith in the ability to effectively manage social and ecological systems, including by geo-engineering if necessary.
Adapted from Riahi et al. 2017
SSP4 is not described here as it has not been prioritized by CMIP6 and the IPCC.
Uncertainty
The term “uncertainty” in climate science does not refer to confidence or lack of confidence in climate projections. The fact that the climate is changing is certain and undeniable. However, there is uncertainty about the magnitude of the change due to:
Natural climate variability—the climate varies naturally with some years being warmer than others
Greenhouse gas emissions—they fluctuate according to populations’ behaviours and cannot be accurately predicted in the long term
Climate models—they are imperfect representations of reality
For more information:
Despite this uncertainty, one thing is certain: the various plausible futures will all be hotter, but at varying magnitudes and rates.
Consult the Changes observed in Quebec section
